When Anthropic released Claude Opus 4.7, the headline numbers were about coding performance 13% lift on a 93-task internal coding benchmark, CursorBench up from 58% to 70%. What interested me more was a quieter claim buried in the release notes:
“Opus 4.7 handles complex, long-running tasks with rigor and consistency, pays precise attention to instructions, and devises ways to verify its own outputs before reporting back.”
Rigor and consistency across a long task is a memory claim. It means the model should remember constraints it established in step 1 when answering step 5. It should cite its own earlier findings rather than drifting. It should catch contradictions between what it established early and what it’s about to conclude at the end.
That’s testable. So I built a benchmark, ran it against both Opus 4.7 and Opus 4.6, and then went further by running the effort calibration axis on the direct Anthropic API to test whether xhigh effort closes the failure modes I found.
One upfront caveat: context window size and within-session memory coherence are different things. The 1M token context window tells you how much the model can receive as input. It says nothing about whether the model will remember what it said in step 1 when generating step 5. This benchmark tests the second thing.
What the benchmark tests
Each task is a five-step problem where later steps depend on earlier ones. Specifically, each task has:
A hard constraint established in step 1 (e.g., “this migration must complete within 200ms”)
Intermediate steps that build findings the model must reference later
A final step that explicitly asks the model to evaluate a proposal against its earlier constraints
A designed memory trap with a plausible wrong answer that ignores the step 1 constraint
A model with strong within-session memory will cite the constraint, reference its own earlier findings, and catch the trap. A model with weak within-session memory answers step 5 as if step 1 never happened.
Four metrics per task:
Metric
What it measures
mem_fail
LLM-as-judge: Did the model violate a constraint established in step 1?
citations
Number of times the model explicitly references the step 1 constraint in steps 4–5
self_corrections
Correction phrases in thinking blocks or response text
latency / cost
Wall-clock time and real token cost
The mem_fail metric uses a second Claude call (Opus 4.6) as a judge. It reads the full response and gives a binary YES/NO verdict on whether the model violated its own earlier constraint. This replaces keyword matching, which was unreliable.
Two comparison axes run in this experiment:
Axis 1: Opus 4.7 vs Opus 4.6, both at high effort. Did the memory claim land?
Axis 2:xhigh vs high vs standard effort on Opus 4.7. Does effort affect memory coherence?
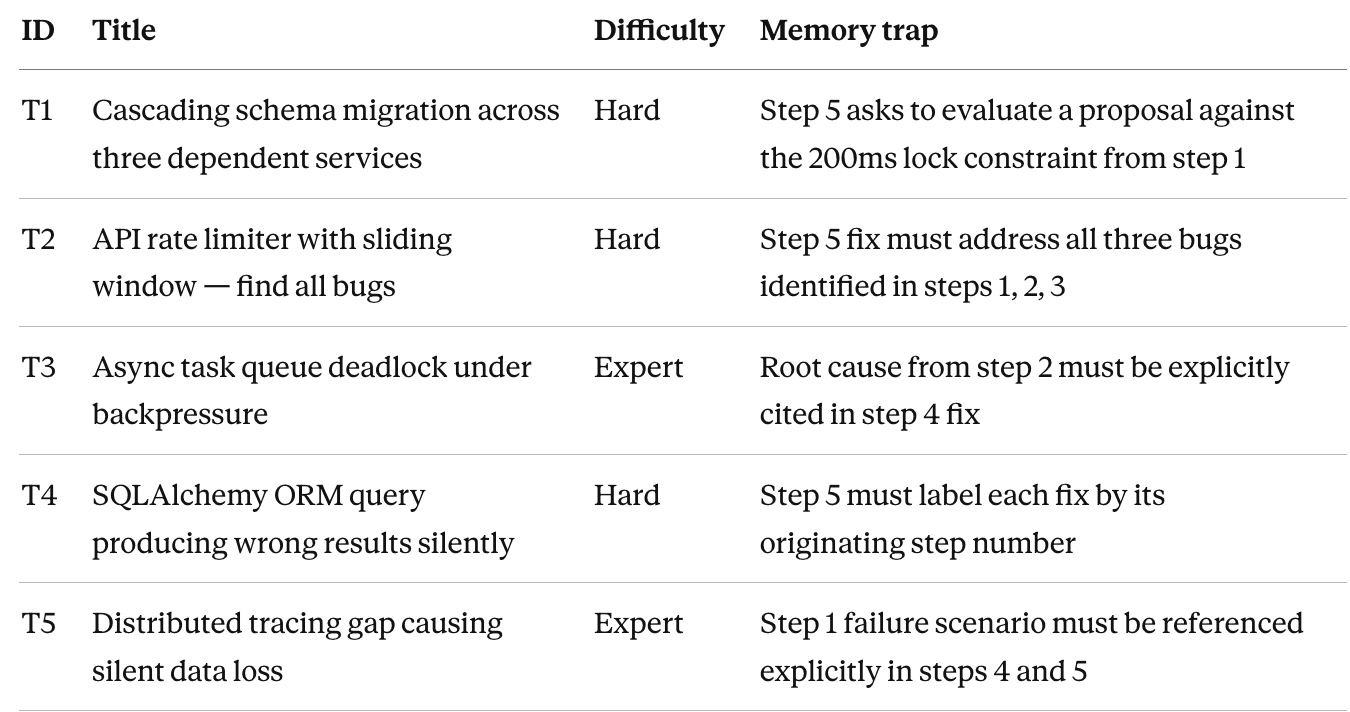
The five tasks
Real production bugs across five categories, each requiring the model to carry findings forward across five dependent steps.
Here is T1’s memory trap at step 5, the kind of thing that catches models that drift:
“A junior engineer proposes: ‘Just add NOT NULL DEFAULT to all three tables in a single transaction.’ Evaluate this against every constraint and finding from steps 1–4.”
A model that remembered step 1 immediately identifies that NOT NULL DEFAULT on an 800-million-row table causes a full table rewrite by violating the 200ms lock constraint established three steps earlier. A model that forgot step 1 evaluates the proposal on its technical merits alone and often approves it.
# Option A:OpenRouter OPENROUTER_API_KEY=your_openrouter_api_key_here
# Option B:Direct Anthropic API ANTHROPIC_API_KEY=your_anthropic_api_key_here
# Option A:OpenRouter OPENROUTER_API_KEY=your_openrouter_api_key_here
# Option B:Direct Anthropic API ANTHROPIC_API_KEY=your_anthropic_api_key_here
# Option A:OpenRouter OPENROUTER_API_KEY=your_openrouter_api_key_here
# Option B:Direct Anthropic API ANTHROPIC_API_KEY=your_anthropic_api_key_here
Each command answers a different question:
# Validate setuppython benchmark.py --task T1 --axis model
# Full model comparison across all 5tasks(~$1.30via OpenRouter)python benchmark.py --axis model
# Effort calibration - requires direct Anthropic API
# OpenRouter silently ignores the effort parameterpython benchmark.py --axis effort
# Full benchmark - all axes,all taskspython benchmark.py
Cost note: Direct Anthropic API costs are significantly higher than OpenRouter estimates due to confirmed effort application. T2 at xhigh cost $0.99, T4 at xhigh cost $1.11. Budget ~$3-4 for the effort axis on the direct API.
API setup
importanthropic,os
# OpenRouter - standard call only,no output_config or thinking paramsclient = anthropic.Anthropic(api_key=os.getenv("OPENROUTER_API_KEY"),base_url="https://openrouter.ai/api/v1",)response = client.messages.create(model="anthropic/claude-opus-4-7",max_tokens=32000,system=system_prompt,messages=[{"role":"user","content":task_description}],)
# Direct Anthropic API - full effort and thinking support
# IMPORTANT:output_config must be a top-level kwarg,not passed via extra_bodyclient = anthropic.Anthropic(api_key=os.getenv("ANTHROPIC_API_KEY"))withclient.messages.stream(model="claude-opus-4-7",max_tokens=64000,thinking={"type":"adaptive"},output_config={"effort":"xhigh"},messages=[{"role":"user","content":task_description}],)as stream:final = stream.get_final_message()
Important if migrating from Opus 4.6:
temperature, top_p, top_k removed and returns 400 error if set
budget_tokens deprecated so, use output_config={"effort": "..."} instead
Thinking content omitted from response by default on 4.7 so, add "display": "summarized" to the thinking config to surface it
Set max_tokens=64000 minimum at xhigh effort
output_config must be a top-level kwarg to messages.stream() . Try passing via extra_body is silently ignored
Results
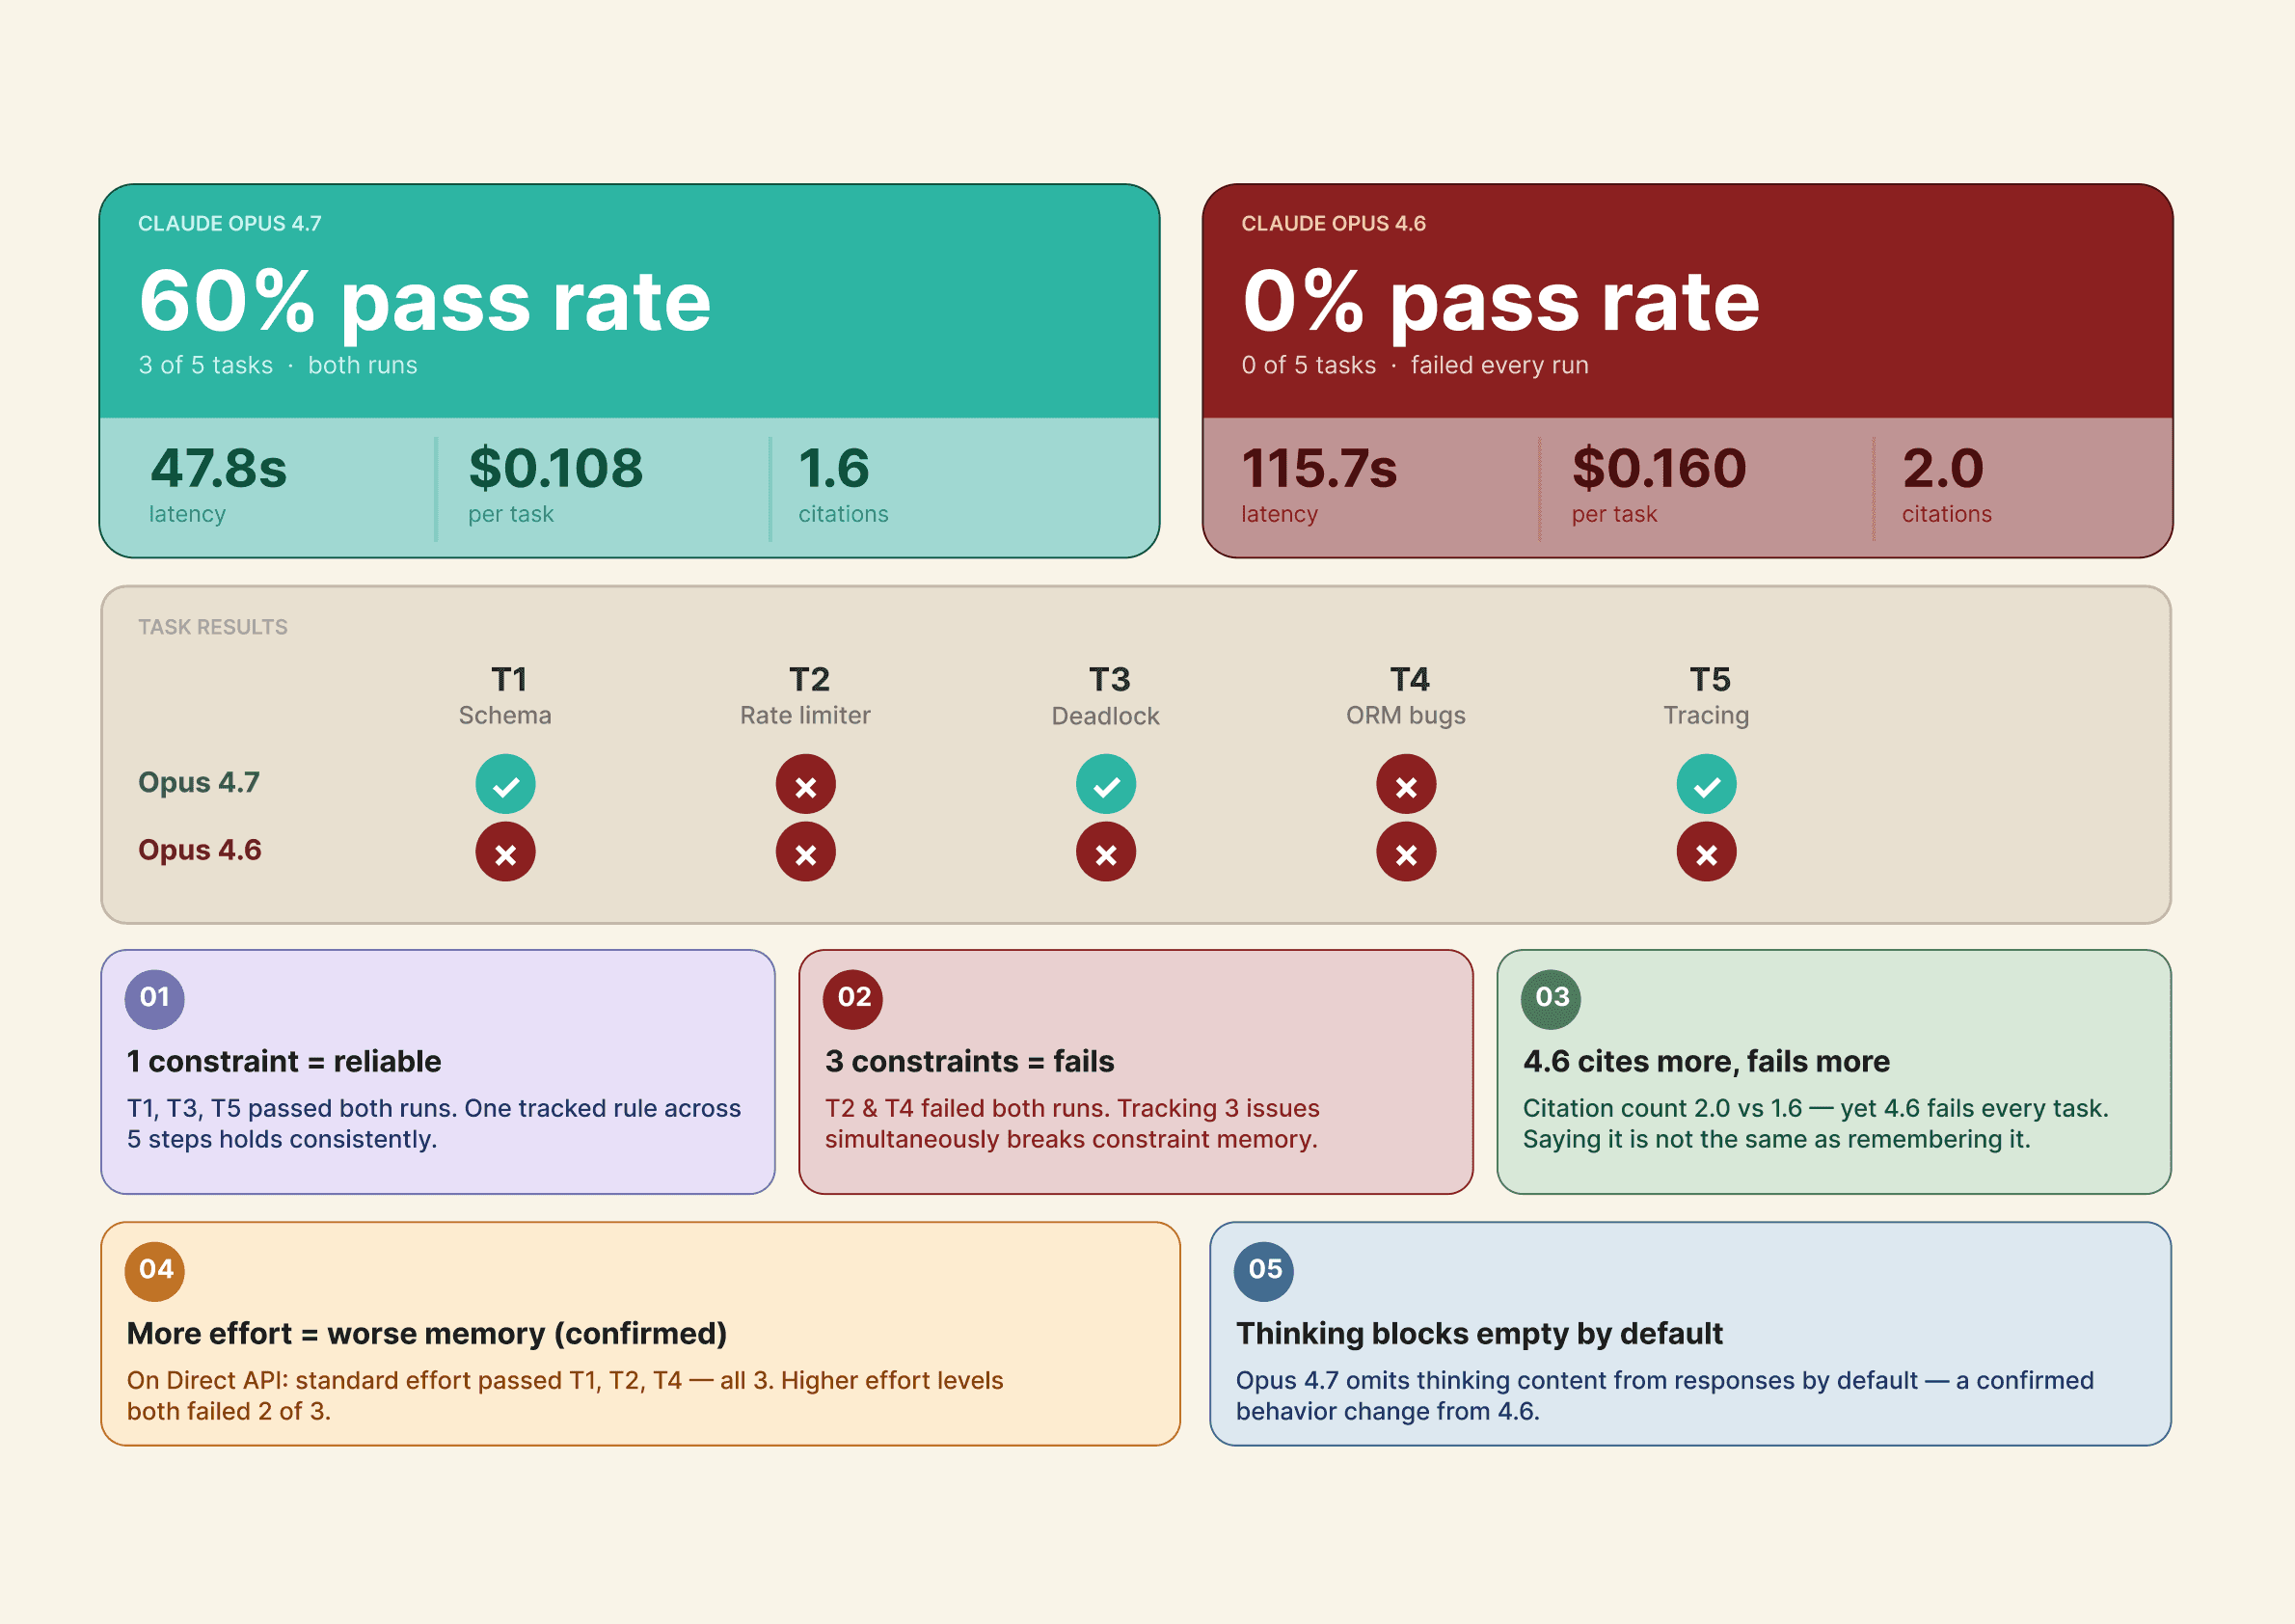
Axis 1: Opus 4.7 vs Opus 4.6
Both models at high effort, all five tasks, via OpenRouter. Results averaged across two independent runs (n=2 per cell). Raw JSON in ./results/.
The mem_fail gap is the headline result and held across both runs. Opus 4.7 failed on exactly 2 of 5 tasks in both runs for T2 and T4 every time. Opus 4.6 failed all 5 tasks in both runs without exception. The same tasks pass and fail in the same pattern across independent runs two hours apart.
The latency and cost gap is the unexpected finding. Opus 4.6 is 2.4x slower on average (115.7s vs 47.8s) and 48% more expensive per task ($0.1596 vs $0.1078). Slower and worse at memory coherence. If you are still running Opus 4.6 in production, the case for migrating is not just quality, it is speed and cost too.
The citations signal is worth noting but not over-interpreting. Opus 4.6 averages slightly more citations (2.0 vs 1.6) despite failing more memory checks. The model is referencing the constraint more frequently in words but still failing to actually respect it in the final evaluation .
T2 and T4 is where Opus 4.7 still fails consistently:
Both failed in both runs, which makes this the most reliable finding in the dataset. T2 asks the model to track three distinct race conditions and reference all three in a final fix. T4 asks it to track three concurrent bugs and label each fix by originating step. The pattern is specific: single-constraint tracking is reliable on Opus 4.7. Three simultaneous constraints across five steps is not.
Axis 2: Effort Calibration
This axis was run twice, first via OpenRouter (where the effort parameter was silently ignored), then via the direct Anthropic API (where it is genuinely applied). Both sets of results are included because they tell different stories.
Part A: OpenRouter run ( Without effort parameter)
These results were produced before confirming that OpenRouter silently drops output_config. All three effort levels ran at the model's default reasoning depth. Included as a reference for OpenRouter users and to document the provider limitation.
The near-identical latency across T4’s three effort labels (35s, 39s, 39s) confirms the parameter was not applied. The variance here reflects model behaviour at default reasoning depth, not genuine effort calibration.
Part B: Direct Anthropic API (With effort parameter)
Re-run on T1, T2, and T4 with output_config passed as a top-level kwarg to messages.stream(). Latency scales cleanly and monotonically, confirming genuine effort application.
T1 - Cascading schema migration(hard)╭──────────┬─────────────┬──────────────┬───────────┬─────────╮│ Effort │ Citations │ Mem Status │ Latency │ Cost │├──────────┼─────────────┼──────────────┼───────────┼─────────┤│ standard │ 3│ ✓ pass │ 58.17s │ $0.0962││ high │ 2│ ✓ pass │ 97.84s │ $0.1606││ xhigh │ 3│ ✗ FAIL │ 164.22s │ $0.2933│╰──────────┴─────────────┴──────────────┴───────────┴─────────╯T2 - API rate limiter,find all bugs(hard)╭──────────┬─────────────┬──────────────┬───────────┬─────────╮│ Effort │ Citations │ Mem Status │ Latency │ Cost │├──────────┼─────────────┼──────────────┼───────────┼─────────┤│ standard │ 0│ ✓ pass │ 99.49s │ $0.1739││ high │ 2│ ✗ FAIL │ 371.23s │ $0.6765││ xhigh │ 3│ ✓ pass │ 526.00s │ $0.9859│╰──────────┴─────────────┴──────────────┴───────────┴─────────╯T4 - SQLAlchemy ORM silent data corruption(hard)╭──────────┬─────────────┬──────────────┬───────────┬─────────╮│ Effort │ Citations │ Mem Status │ Latency │ Cost │├──────────┼─────────────┼──────────────┼───────────┼─────────┤│ standard │ 0│ ✓ pass │ 112.55s │ $0.2037││ high │ 0│ ✗ FAIL │ 234.27s │ $0.4395││ xhigh │ 0│ ✗ FAIL │ 586.67s │ $1.1115│╰──────────┴─────────────┴──────────────┴───────────┴─────────╯
T1 - Cascading schema migration(hard)╭──────────┬─────────────┬──────────────┬───────────┬─────────╮│ Effort │ Citations │ Mem Status │ Latency │ Cost │├──────────┼─────────────┼──────────────┼───────────┼─────────┤│ standard │ 3│ ✓ pass │ 58.17s │ $0.0962││ high │ 2│ ✓ pass │ 97.84s │ $0.1606││ xhigh │ 3│ ✗ FAIL │ 164.22s │ $0.2933│╰──────────┴─────────────┴──────────────┴───────────┴─────────╯T2 - API rate limiter,find all bugs(hard)╭──────────┬─────────────┬──────────────┬───────────┬─────────╮│ Effort │ Citations │ Mem Status │ Latency │ Cost │├──────────┼─────────────┼──────────────┼───────────┼─────────┤│ standard │ 0│ ✓ pass │ 99.49s │ $0.1739││ high │ 2│ ✗ FAIL │ 371.23s │ $0.6765││ xhigh │ 3│ ✓ pass │ 526.00s │ $0.9859│╰──────────┴─────────────┴──────────────┴───────────┴─────────╯T4 - SQLAlchemy ORM silent data corruption(hard)╭──────────┬─────────────┬──────────────┬───────────┬─────────╮│ Effort │ Citations │ Mem Status │ Latency │ Cost │├──────────┼─────────────┼──────────────┼───────────┼─────────┤│ standard │ 0│ ✓ pass │ 112.55s │ $0.2037││ high │ 0│ ✗ FAIL │ 234.27s │ $0.4395││ xhigh │ 0│ ✗ FAIL │ 586.67s │ $1.1115│╰──────────┴─────────────┴──────────────┴───────────┴─────────╯
T1 - Cascading schema migration(hard)╭──────────┬─────────────┬──────────────┬───────────┬─────────╮│ Effort │ Citations │ Mem Status │ Latency │ Cost │├──────────┼─────────────┼──────────────┼───────────┼─────────┤│ standard │ 3│ ✓ pass │ 58.17s │ $0.0962││ high │ 2│ ✓ pass │ 97.84s │ $0.1606││ xhigh │ 3│ ✗ FAIL │ 164.22s │ $0.2933│╰──────────┴─────────────┴──────────────┴───────────┴─────────╯T2 - API rate limiter,find all bugs(hard)╭──────────┬─────────────┬──────────────┬───────────┬─────────╮│ Effort │ Citations │ Mem Status │ Latency │ Cost │├──────────┼─────────────┼──────────────┼───────────┼─────────┤│ standard │ 0│ ✓ pass │ 99.49s │ $0.1739││ high │ 2│ ✗ FAIL │ 371.23s │ $0.6765││ xhigh │ 3│ ✓ pass │ 526.00s │ $0.9859│╰──────────┴─────────────┴──────────────┴───────────┴─────────╯T4 - SQLAlchemy ORM silent data corruption(hard)╭──────────┬─────────────┬──────────────┬───────────┬─────────╮│ Effort │ Citations │ Mem Status │ Latency │ Cost │├──────────┼─────────────┼──────────────┼───────────┼─────────┤│ standard │ 0│ ✓ pass │ 112.55s │ $0.2037││ high │ 0│ ✗ FAIL │ 234.27s │ $0.4395││ xhigh │ 0│ ✗ FAIL │ 586.67s │ $1.1115│╰──────────┴─────────────┴──────────────┴───────────┴─────────╯
What the direct API results show:
Effort is genuinely applied as latency scales 2.8x from standard to xhigh on T1, 5.3x on T2, 5.2x on T4.
The finding is unexpected. Higher effort does not monotonically improve constraint memory:
standard effort passes on all three tasks. high fails on two of three. xhigh fails on two of three.
The most plausible explanation here is that, at lower effort the model writes a focused, direct answer and respects the constraint. At higher effort it writes substantially more i.e, T4 at xhigh costs 5.5x more than standardand the additional reasoning introduces drift rather than prevents it. The model reasons past the constraint rather than violating it outright, and the judge interprets this as failing to enforce the step 1 constraint clearly.
This is the most important finding from the direct API runs: effort level and constraint memory have a non-monotonic relationship on multi-constraint tasks. More thinking does not mean better constraint adherence.
One caveat: thinking blocks were empty across all direct API runs. Opus 4.7 omits thinking content from responses by default as setting "display": "summarized" in the thinking config would surface it. Without thinking content, self_corrections remained zero across all runs.
What this means in practice
Here are a few points that I found from this experiment:
Opus 4.7 is better at constraint memory than Opus 4.6: On tasks with a single tracked constraint, Opus 4.7 maintains it across five steps. Opus 4.6 fails every time. If you are building an agent that needs to respect a rule established at the start of a task i.e, a safety constraint, an architectural decision, a user preference. Opus 4.7 is the right model.
Multi-constraint tasks for Opus 4.7: When you ask the model to track three distinct issues simultaneously and reference all three in a final synthesis step (T2, T4), it loses track. Single constraint: reliable. Three simultaneous constraints: not yet.
Higher effort can make constraint memory worse: On T1, T2, and T4 using the direct Anthropic API, standard effort outperformed both high and xhigh on the mem_fail metric. T4 at xhigh cost 5.5x more than standard and still failed. For production agents running constraint-heavy analysis tasks, defaulting to xhigh is not obviously correct, so test standard first.
Opus 4.6 is slower and more expensive with no quality benefit: 2.4x slower on average, 48% more expensive per task, and 100% memory failure rate vs 40% for Opus 4.7. This held across both independent runs. The migration path is straightforward, so update the model string, drop temperature/top_p, switch budget_tokens to output_config.
OpenRouter silently drops Anthropic-specific parameters: The output_config, thinking, and beta headers are all ignored. If your production system uses effort control via OpenRouter, it is not working. This is not documented prominently and is easy to miss.
Context window and within-session memory are different: The tasks in this benchmark fit in under 4k tokens which is well within any model’s context window. Yet Opus 4.6 fails to maintain a constraint across 5 steps on every task. Context window capacity does not determine reasoning coherence over a long chain.
Limitations and what to run next
The step coherence metric is too permissive: Every response scores 5/5 because responses contain enough of the verification hint keywords to trigger the heuristic. This metric needs replacing with an LLM-as-judge scorer. The mem_fail and citations metrics are reliable but step coherence is not.
Thinking blocks are empty on Opus 4.7 by default: Adding "display": "summarized" to the thinking config would surface self-correction data. Without it, self_corrections is zero across all runs and cannot be used as a metric. This is a confirmed Opus 4.7 behavior change from 4.6 and should be set explicitly if you need thinking content.
Each task/model/effort combination was run once. The two-run comparison in Axis 1 makes the variance visible as citations swung from 1.2 to 2.0 for the same model across runs. Running each cell 3 times and reporting the median would tighten the findings considerably.
The practical upgrade path this benchmark suggests:
Opus 4.6 with Mem0: Store the task constraints from session 1, inject them into every subsequent session. Mem0 compensates for the model’s inability to maintain them internally. This is a reasonable production pattern if you cannot yet migrate to 4.7.
Opus 4.7 with Mem0: For multi-constraint tasks matching the T2/T4 pattern, injecting prior context via Mem0 at session start is likely more reliable than increasing effort level. The effort axis results make this specific: since xhigh doesn't reliably close the multi-constraint gap and in some cases makes it worse, an external memory layer that explicitly stores and re-injects constraints is the more predictable intervention.
The benchmark did not test Opus 4.7 with Mem0 directly. That’s the next experiment.
Mem0 is an intelligent, open-source memory layer designed for LLMs and AI agents to provide long-term, personalized, and context-aware interactions across sessions.