

TL;DR
Kimi K2.6 ran autonomously for 12 hours, made 4,000 tool calls, and beat LM Studio by 21%, not because the model is smarter, but because its memory system enables branching, regression testing, and regime-switching. This piece reads the two execution traces.
💡If you're building agents that need this kind of persistent, context-aware memory: Mem0 gives you the same memory infrastructure in 3 lines of code.
Moonshot AI’s Kimi K2.6 launch blog is full of the usual things: benchmark tables, partner testimonials, a license file. Most of the coverage has fixated on the benchmark numbers like SWE-Bench Pro 58.6, HLE-with-tools 54.0, and DeepSearchQA 92.5.
Buried in the middle of the post are two charts that almost nobody has engaged with. One is titled “LLM Inference on M3 Max — Performance Evolution” and shows the minute-by-minute trace of a 12-hour autonomous agent run optimizing a Zig inference kernel. The other is titled “Multi-Objective Performance Optimization” and shows the Pareto trajectory of a 13-hour autonomous run refactoring an 8-year-old financial matching engine.
Kimi K2.6 Hardware and Memory Requirements
Running Kimi K2.6 locally requires at least 350GB of combined RAM and VRAM for Q2 quantization. Full-quality inference requires 8× H100 or H200 GPUs.
Configuration | Quantization | Disk space | RAM + VRAM | GPU requirement | Inference speed |
|---|---|---|---|---|---|
Minimum local | Q2 (UD-Q2_K_XL) | 340GB | 350GB+ | CPU offload viable | Slow |
Recommended local | Q4 (UD-Q4_K_XL) | 584GB | ~600GB | 8× H100 80GB | Moderate |
Lossless | Q8 (UD-Q8_K_XL) | 595GB | ~600GB+ | 8× H200 141GB | Fast |
Full precision | FP16 | 610GB | ~2TB | 16× H100 80GB | Production |
Cloud / API | — | — | — | Managed | >40 tok/s (B200s) |
Context window: 256K tokens (262,144 max). For local runs, Moonshot recommends staying within 98,304 tokens to maintain stable performance.
Architecture: 1T total parameters, 32B active per token via Mixture-of-Experts routing across 384 experts. Only the active 32B are computed on each forward pass, which is why the model fits in far less memory than a dense 1T model would require.
The INT4 sweet spot: Kimi K2.6 ships with native INT4 Quantization-Aware Training (QAT). Compared to FP16, INT4 QAT delivers roughly 2× faster inference and around 50% less GPU memory usage with minimal quality loss. For most teams evaluating local deployment, the Q4 quant at ~600GB RAM+VRAM is the practical target.
Rule of thumb for memory planning: combined RAM and VRAM should roughly equal the quantization file size. A 340GB Q2 quant needs 350GB+ of combined RAM and VRAM. A 584GB Q4 quant needs around 600GB. There is no shortcut around this number.
The four variants:
K2.6 Instant: fast, low-latency responses for interactive use cases where speed matters more than depth.
K2.6 Thinking: extended reasoning with visible chain-of-thought for complex multi-step problems.
K2.6 Agent: the autonomous coding and tool-use model, the one running in the 12-hour traces below.
K2.6 Agent Swarm: multi-agent coordination for tasks that benefit from parallel exploration across several independent agent instances.
What the Memory Requirements Tell You About the Architecture
The hardware numbers above explain the what. The execution traces below explain the why, specifically, why a model this size can run autonomously for 12 hours without losing coherence. The answer is not parameter count. It is memory architecture.
Kimi K2.6 bakes its memory system into the model weights: durable state across thousands of tool calls, regression-testing behavior after a winning version, and regime-exhaustion pivots when a strategy stops yielding gains. That is powerful, but it is also fixed. You get Kimi's memory behavior with Kimi's model. If you want the same persistent memory patterns with GPT-4o, Claude, or a fine-tuned local model, that is the problem Mem0 solves at the infrastructure layer.
Add persistent memory to your agent in 3 lines of code
Let’s go through these charts together!
Act 1: Zig kernel run (12 hours)
The first chart is the telemetry from Moonshot’s now-famous Zig demo, the one where K2.6 was pointed at “optimize local inference of Qwen3.5–0.8B on a Mac using Zig” and left to run autonomously. Across 14 iterations, 4,000+ tool calls, and 12 hours of continuous execution, it took throughput from ~15 tok/s to ~193 tok/s — roughly 20% faster than LM Studio.
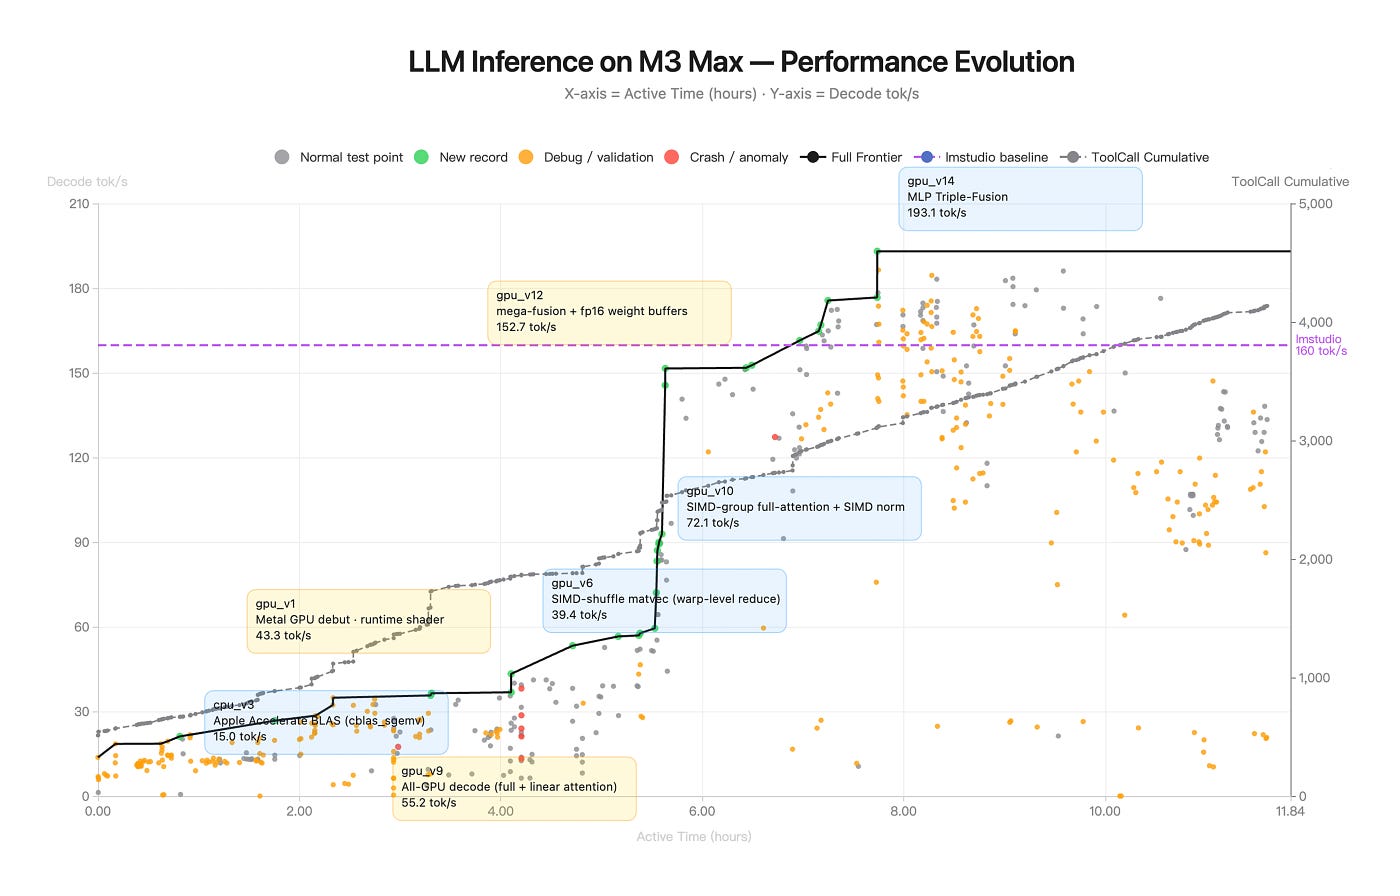
Figure: LLM Inference on M3 Max — Performance Evolution (source: Kimi K2.6 Blog)
The axes:
X-axis: active wall-clock time (0 to 11.84 hours)
Left Y-axis: decode throughput (tokens/sec) [higher is better]
Right Y-axis: cumulative tool calls made by the agent (0 to ~4,000)
The markings:
Gray dots: every benchmark the agent ran
Green dots: new records (frontier advances)
Orange dots: debug / validation runs (testing without expecting a new best)
Red dots: crashes or anomalies
Black staircase line: the Pareto frontier which is the best throughput achieved so far
Purple dashed line: LM Studio baseline (160 tok/s) [the target]
Gray dashed line: cumulative tool calls, a roughly linear climb from 0 to ~4,000
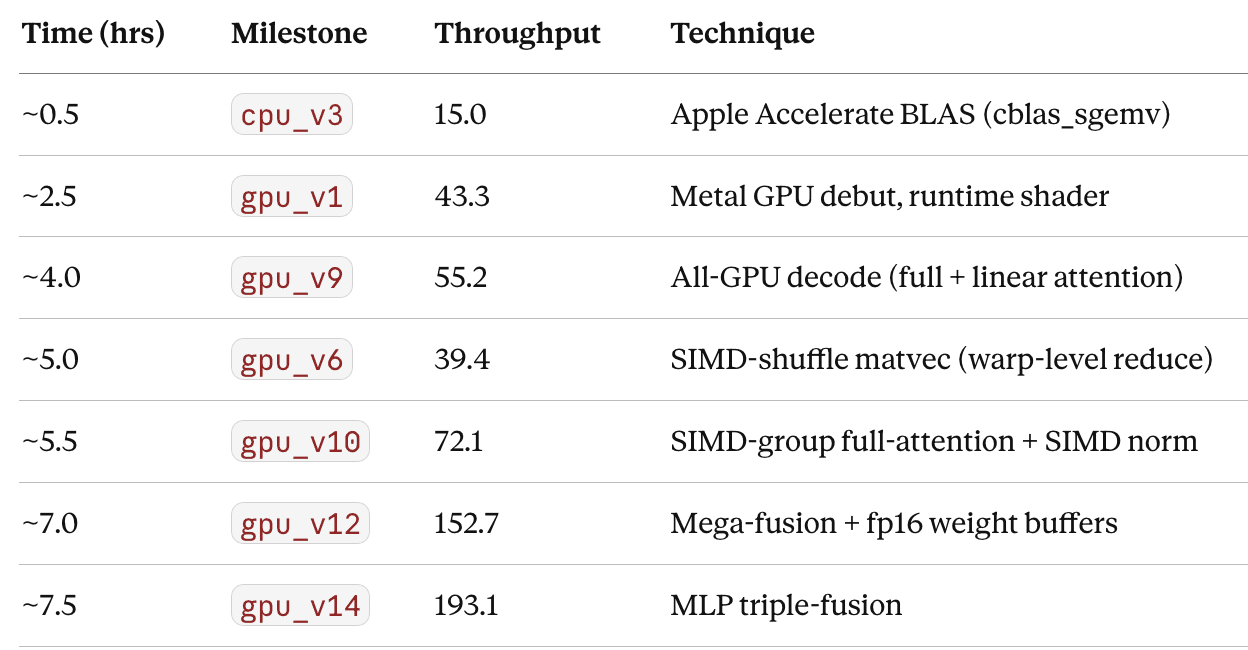
There are nine labeled milestones: cpu_v3 (15 tok/s), gpu_v1 (43.3), gpu_v6 (39.4), gpu_v9 (55.2), gpu_v10 (72.1), gpu_v12 (152.7), gpu_v14 (193.1), plus two unannotated intermediates.
That’s what the picture says literally. Here’s what it says if you actually look at it.
Observation 1: The frontier is a staircase, not a ramp
The most obvious thing is that the black frontier line is not a smooth curve. It’s a step function. Long flat plateaus punctuated by sharp vertical jumps.
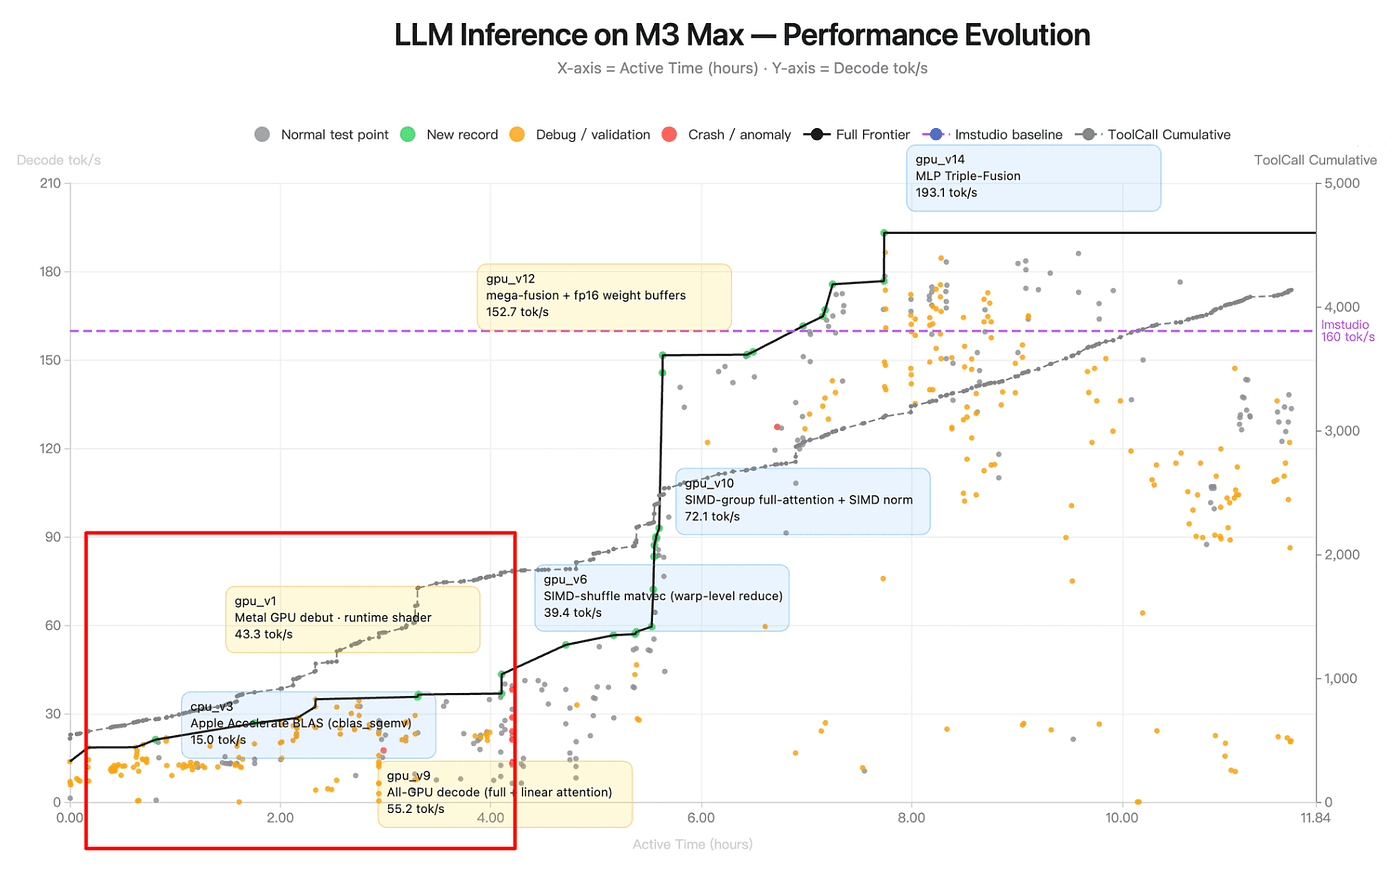
Figure: LLM Inference on M3 Max — Performance Evolution (source: Kimi K2.6 Blog)
The plateaus are the interesting part. Between cpu_v3 (hour ~0.5, 15 tok/s) and gpu_v1 (hour ~2.5, 43 tok/s), nothing happens on the frontier, but the chart is dense with gray and orange dots. The agent is running experiments that aren't yielding new records, and then eventually one does. The agent is doing exploration followed by discrete architectural commitments:
Note that the version numbers do not match time order. gpu_v9 appears on the chart before gpu_v6. gpu_v1 doesn't arrive on the frontier until hour 2.5, well after cpu_v3. This isn't a labeling bug , the Moonshot's release text says the run went through "14 iterations," which means v1 through v14 exists as a numbered sequence, and the agent clearly did not execute them in numerical order.
This tells us that the agent was branching and revisiting, not marching sequentially. It tried the v9 direction (all-GPU decode with hybrid attention) early. It spent time on the v6 lineage (SIMD-shuffle matvec) after v9 was already on the frontier. Then it broke through with v10, which is essentially a refinement of the v9 direction cross-pollinated with what it learned from the v6 detour.
A branching agent maintains multiple candidate directions in memory, explores each, and returns to promising ones. That requires durable memory of abandoned paths that you can’t branch-and-return without a ledger of what the branches even were.
Each jump is still a technique change, not a parameter tweak. The agent is identifying regimes and then exploring within each regime until it finds the next one. This is taxonomy-building, not gradient descent.
Observation 2: The orange dots tell the memory story more clearly than the green ones
The green dots are the celebrities. The orange ones are the story.
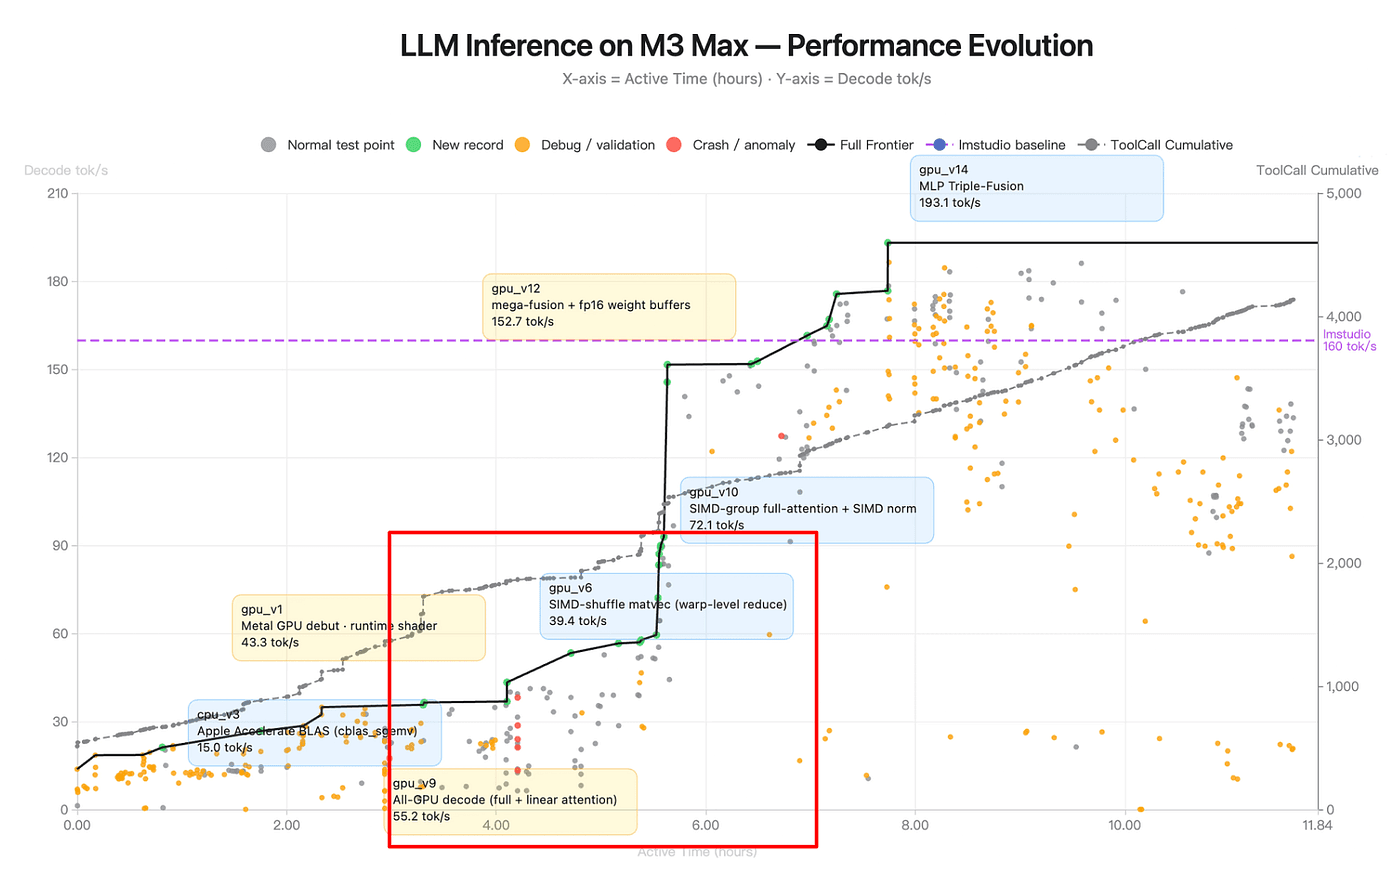
Figure: LLM Inference on M3 Max — Performance Evolution (source: Kimi K2.6 Blog)
Orange = debug / validation runs. Not attempts to set new records — attempts to verify or regression-test existing versions. Count where they cluster:
Hours 3–5: moderate orange density, mostly around the
gpu_v6togpu_v9transitionHours 7–11: the orange cluster explodes ie., high density, scattered across a wide throughput range, many of them well below the current frontier
That second cluster is the key. The agent already has a 193 tok/s kernel by hour 7.5. It doesn’t need to validate anything to claim victory. But it keeps running tests on older, slower configurations for another 4 hours.
Why would you regression-test versions you’ve already superseded? Because you’re ablating. Because you want to know whether gpu_v14's gain came from the triple-fusion or from an earlier change that happened to stack with it. Because you want to confirm that a known-bad config is still bad on your current code, meaning you haven't accidentally broken something.
An agent that regression-tests is an agent with persistent memory of its past states. You cannot do this from context-window memory alone. 256K tokens is not enough to hold twelve versions of a Metal shader plus their benchmark results plus all the reasoning that led to them.
The orange dots are the visible trace of the agent reading from a durable ledger it’s been maintaining the whole time. This is skills-as-memory in action, or an external scratchpad, or something architecturally similar. It has to be. There’s no other way to explain this behavior.
Observation 3: The tool-call line is linear, and that’s the most boring and the most important thing on the chart
The gray dashed line shows cumulative tool calls that climbs from 0 to ~4,000 over the full 11.84 hours. It’s nearly straight.
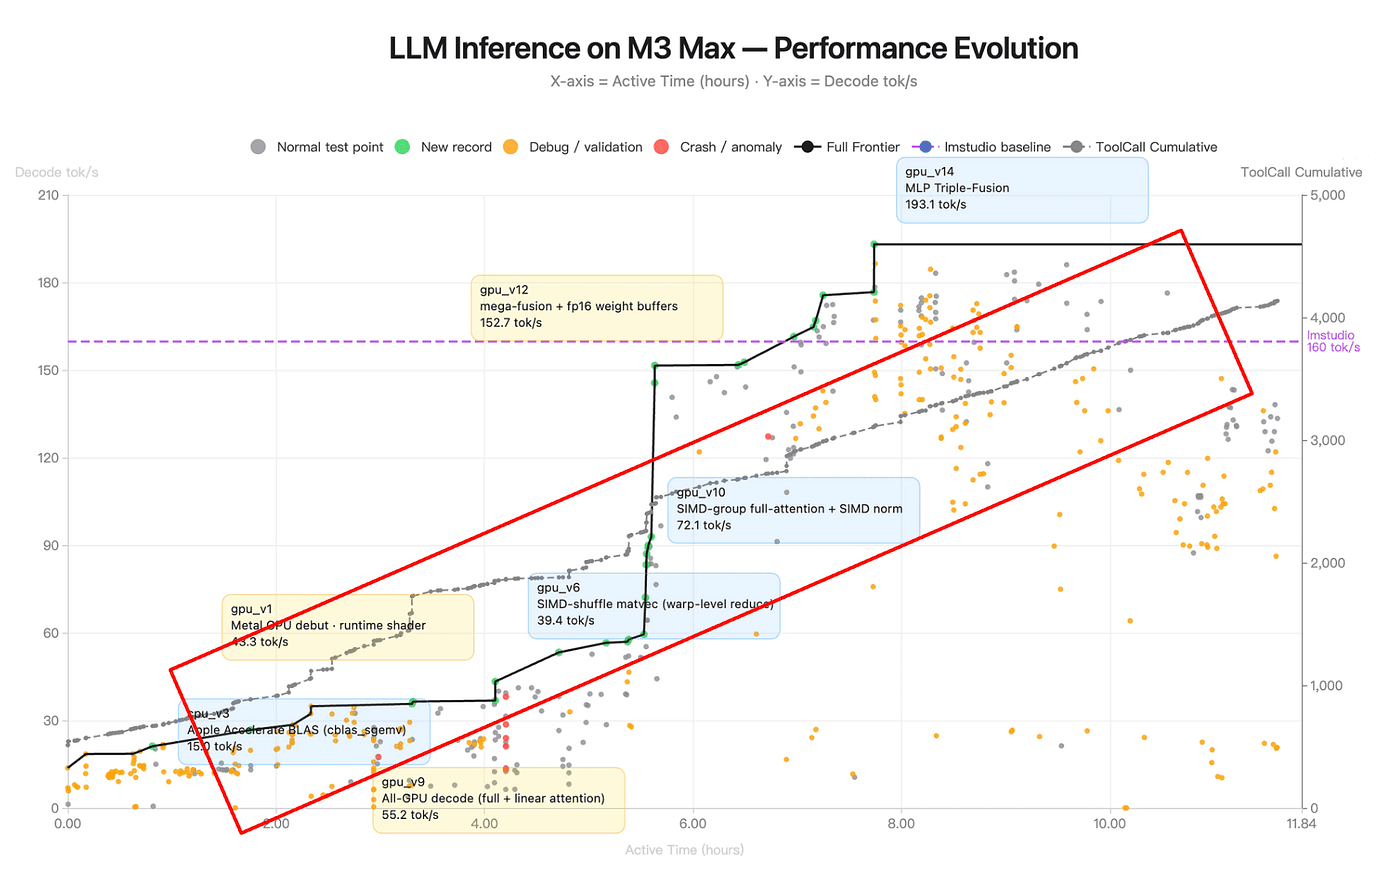
Figure: LLM Inference on M3 Max — Performance Evolution (source: Kimi K2.6 Blog)
That means the agent’s tool-call rate is stable across twelve hours. Roughly 340 tool calls per hour from start to finish. No deceleration as context fills. No acceleration as it “warms up” and just a steady, metronomic pace.
This is the opposite of what you’d see in a naive agent. Every long-running agent I’ve personally watched Claude Code, Cursor, various home-rolled setups that show one of two patterns as runtime grows:
Slowdown: as context fills, each generation gets longer (the model has to attend over more tokens), tool calls space out, progress crawls.
Cliff: context fills, the harness starts truncating aggressively, the model loses thread, and either the rate spikes (flailing) or collapses (stuck).
K2.6 shows neither. The line is straight. This implies the agent is running with a bounded working-memory envelope so the context stays within some operational band, regardless of wall-clock time. Which means something is actively managing it. Either the model is compressing its own history, or the Kimi Code harness is, or both.
This is the single strongest piece of evidence that K2.6 is doing what one analysis called “automatic context compression i.e, the model summarizes and elides its own history when approaching the window.” You can see it in the straight line.
Observation 4: Red dots cluster
The red dots cluster in a tight window around hours 3–4.5, right where the frontier is jumping from the gpu_v6 plateau to the gpu_v9 "all-GPU decode" regime.
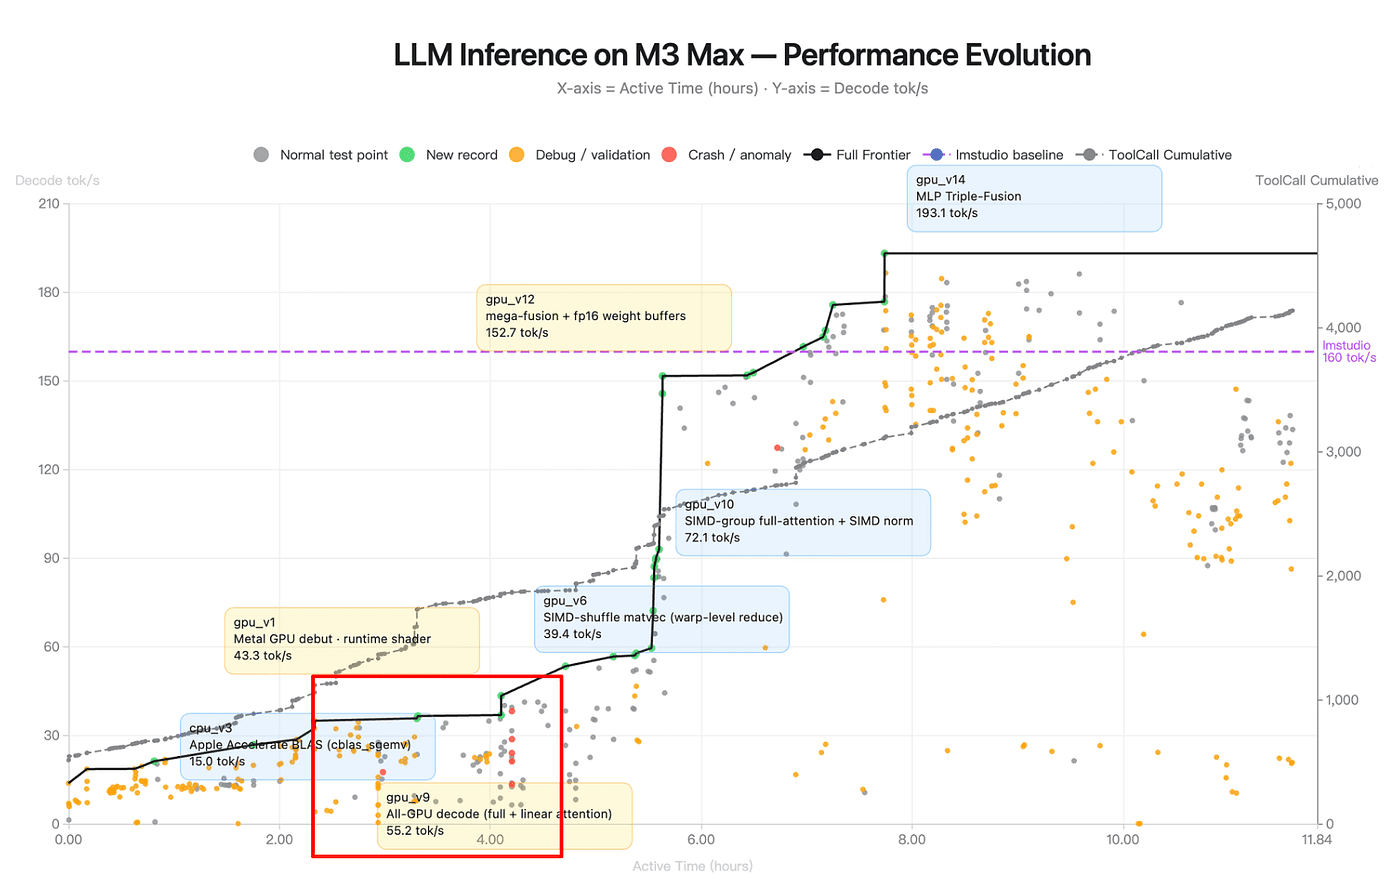
Figure: LLM Inference on M3 Max — Performance Evolution (source: Kimi K2.6 Blog)
After hour 5, I can count zero red dots on the chart.
If context drift were the dominant failure mode for long-horizon agents (as it is for most), you’d expect crashes to increase with runtime because of more context, more chances to hallucinate a stale variable, more chances to issue a tool call against a state that no longer exists. K2.6 shows the inverse. Crashes happen early, during architectural exploration, and then stop.
The most plausible explanation is that the agent crashes while it’s still learning the environment, and once it has written those lessons down into its scratchpad, its skills, its summary file, it stops making the same mistakes. The runtime stability in hours 5–11 isn’t because the model got better. It’s because the agent built a persistent working-knowledge base of the environment in the first few hours and then used it.
If true, this is a big deal. It means K2.6’s long-horizon reliability isn’t emergent from model scale but it’s emergent from procedural memory accumulated during the run itself.
Observation 5: The v9 → v6 → v10 detour
The most revealing stretch on the chart is hours 4 through 5.5. Here’s what happens, in order:
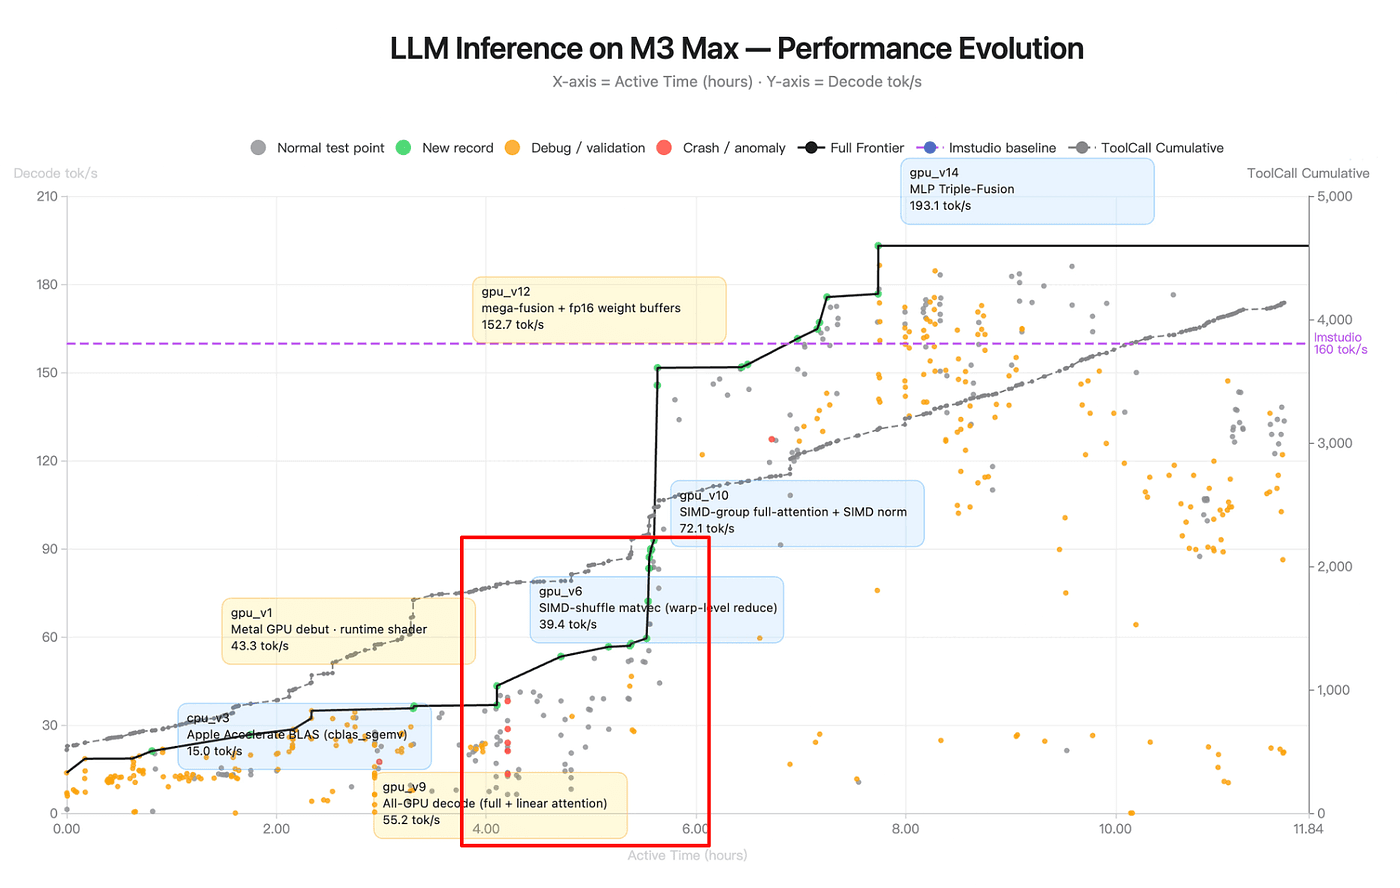
Figure: LLM Inference on M3 Max — Performance Evolution (source: Kimi K2.6 Blog)
Hour ~4: frontier jumps to
gpu_v9at 55.2 tok/s. Technique: all-GPU decode with hybrid full + linear attention.Hours 4–5: frontier flatlines at 55.2. One full hour of tool calls with no new record. The red crashes cluster in this zone. Orange debug dots multiply.
Hour ~5: the agent labels
gpu_v6at 39.4 tok/s. This is a SIMD-shuffle matvec variant — note the version number is lower than v9, even though it appears later in time.Hour ~5.5: frontier jumps sharply to
gpu_v10at 72.1 tok/s. Technique: SIMD-group full-attention + SIMD norm.
The agent commits to v9, runs it, holds the frontier. Then, instead of just iterating v9 forward, it returns to an older, slower branch (v6, SIMD-shuffle) that it had presumably worked on earlier. The red crashes during the plateau suggest something about the hybrid attention was crashing under specific conditions. So the agent detours and it goes back to v6-lineage work to harvest techniques (SIMD-shuffle warp-level reduce patterns) it can cross-pollinate into a more robust version of v9. The result is v10: “SIMD-group full-attention + SIMD norm” which is structurally similar to v9 but with SIMD-group primitives from the v6 branch grafted in.
This is branch exploration with cross-pollination. The agent didn’t abandon v9 when it got stuck. It didn’t blindly iterate. It went back to an older branch, mined it for relevant techniques, and synthesized them forward. That requires:
Memory that branch v6 existed and what it contained
Memory that v9 was the current-best despite crashes
The judgment to not roll back to v6 just because v9 is brittle
The synthesis to combine elements of both into v10
Most long-running agents I’ve watched are loss-averse i.e, if the current direction is crashing, they revert. K2.6 didn’t revert. It detoured, harvested, and synthesized. That requires an internal narrative about why v9 is strategically correct even if tactically unstable, plus a memory model rich enough to support “v6 knows something v9 needs.”
Observation 6: The baseline crossing has narrative weight
The LM Studio baseline is 160 tok/s — the dashed purple line. The agent’s journey has a clean three-phase structure around it:
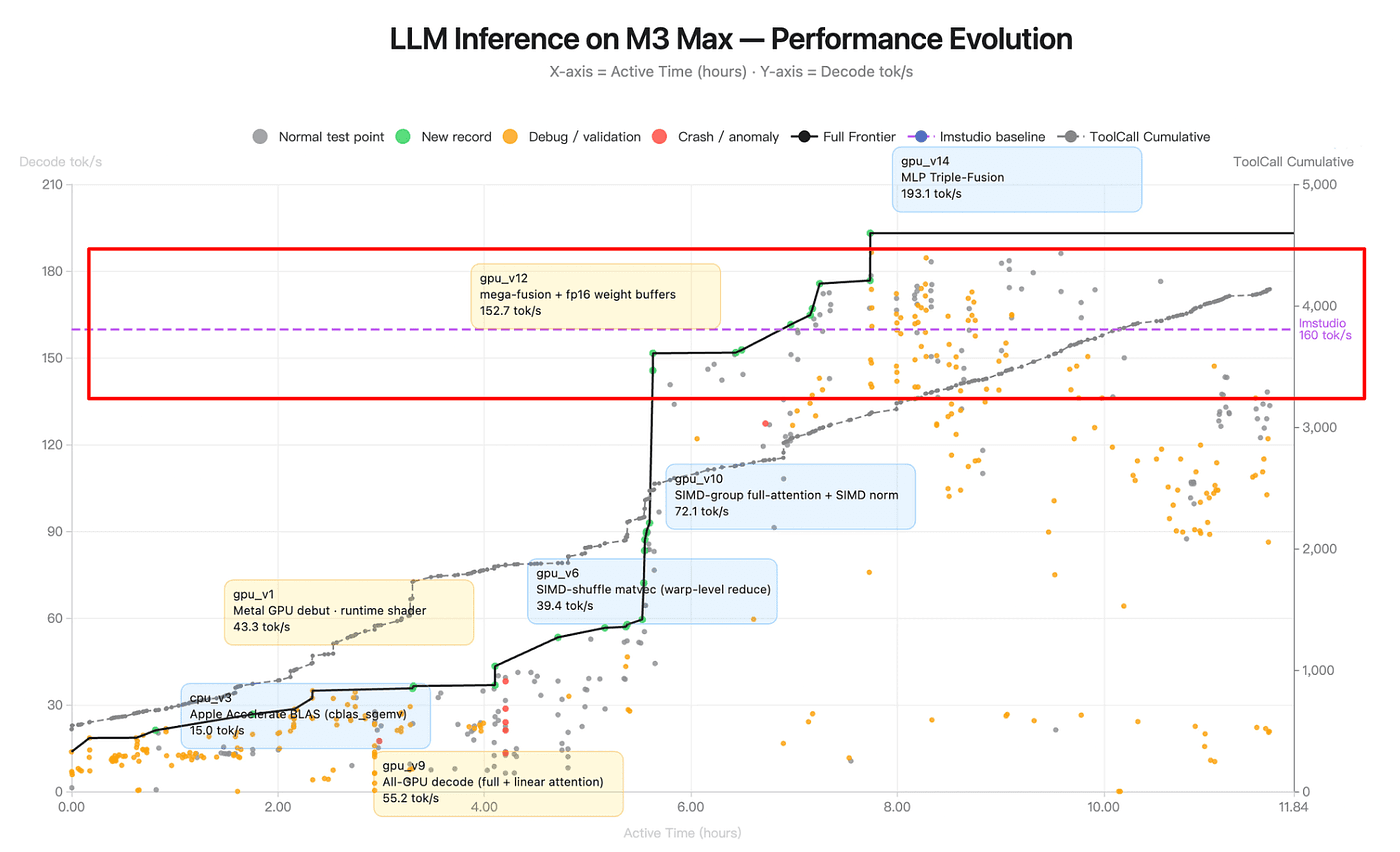
Figure: LLM Inference on M3 Max — Performance Evolution (source: Kimi K2.6 Blog)
Phase 1 (hours 0–4): Catching up. CPU-only and early GPU work. Frontier climbs from 15 to ~55.
Phase 2 (hours 4–7.5): Closing the gap. SIMD-group attention, fused kernels. Frontier climbs from 55 to 152.7 , just under baseline.
Phase 3 (hours 7.5–12):
gpu_v14MLP triple-fusion pushes to 193.1, ~21% above baseline. The final 4 hours are spent regression-testing and confirming robustness.
The agent crosses baseline at roughly hour 7.5 i.e, two-thirds of the way through the run. The remaining third is not spent trying to push the number higher. That’s a judgment call about when to stop optimizing and start validating. Humans make that call all the time. I have almost never seen an agent make it voluntarily.
Act 2: Exchange-core run (13 hours)
The Zig chart is impressive, but a skeptic can dismiss it as one cherry-picked run. So let’s look at the second chart Moonshot published from a completely different task, with a completely different visualization style.
This one is from the exchange-core run: an 8-year-old open-source financial matching engine that K2.6 was asked to refactor. It required 13 hours of execution, 12 optimization strategies, 1,000+ tool calls, 4,000+ lines of code modified, including a reconfiguration of the core thread topology from 4ME+2RE to 2ME+1RE. The agent analyzed CPU and allocation flame graphs to find bottlenecks.
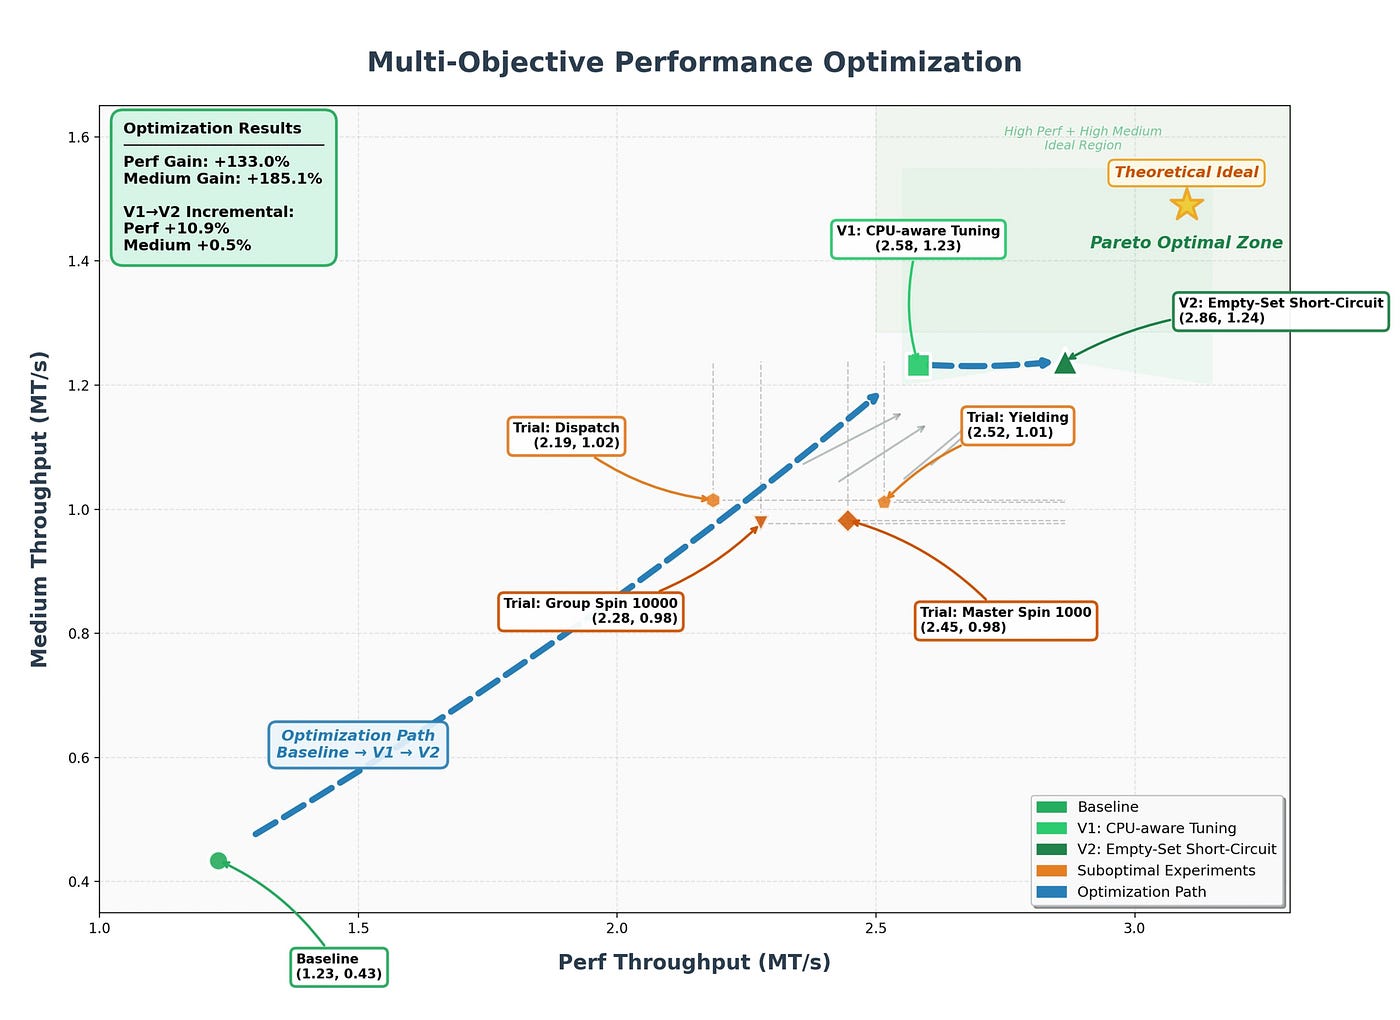
Figure: Multi-Objective Performance Optimization (Source:Kimi Blog)
The chart is not a time series. It’s a 2D Pareto plot:
X-axis: Perf Throughput (peak, MT/s) which means how fast the engine can run in bursts
Y-axis: Medium Throughput (sustained median, MT/s) which means how fast it runs under steady load
Every point is one version of the code. The three labeled committed versions are:
Baseline: (1.23 perf, 0.43 medium), where the 8-year-old codebase started
V1: CPU-aware Tuning: (2.58, 1.23) with +110% perf, +186% medium
V2: Empty-Set Short-Circuit: (2.86, 1.24) with +10.9% perf, +0.5% medium incremental
Here are some observations from this chart:
Observation 7: This chart is already a curated summary
This chart has seven labeled points. Moonshot tells us the run involved 12 optimization strategies and 1,000+ tool calls, but the chart distills all of that into two committed versions, four failed trials, and a baseline.
Figure: Multi-Objective Performance Optimization (Source:Kimi Blog)
Where did the other ~6 strategies go? Almost certainly into the silent gray arrows you can see pointing up-and-right from the suboptimal cluster toward V1 — those are unlabeled intermediate attempts.
A naive agent log would be a flat list of ~1,000 tool calls. This chart implies a log organized as Baseline → {committed V1, committed V2} + {labeled failed trials A, B, C, D} + {silent exploration}. That’s three tiers of provenance. The agent isn’t just running experiments, it’s classifying them as it goes. That’s a memory artifact.
Observation 8: The V1 to V2 commit is the most sophisticated move
Look at the incremental gain from V1 to V2: +10.9% peak perf, +0.5% medium. The medium number is essentially noise. A single-objective reward-maximizer would look at V2 and ask: “why are we spending time on a change that doesn’t improve the headline metric?”
Figure: Multi-Objective Performance Optimization (Source:Kimi Blog)
But the chart labels V2 as a deliberate commit, not a suboptimal experiment. And the reason is visible on the plot: V1 sits at (2.58, 1.23). V2 moves to (2.86, 1.24). The medium axis is already saturated near its ceiling, the theoretical ideal is only 1.5. V2 is pushing the peak axis, which has more headroom (ideal ~3.2), without giving up any of the hard-won medium gains.
This is multi-objective Pareto reasoning. The agent correctly identified that medium-throughput optimization had hit diminishing returns and pivoted to the axis with more room. That requires:
A mental model of both objectives simultaneously
An estimate of where each axis’s ceiling is
The judgment to accept a 0.5% gain on one axis when the other moves 10.9%
I have never seen an agent do this. Most agents optimize a single scalar reward, and when they’re given a vector reward, they tend to over-commit to whichever dimension moved most recently. K2.6 held both dimensions in view across the full run and made the correct strategic trade-off.
Observation 9: The suboptimal cluster is a regime-exhaustion signal
Look at where the four labeled failed trials sit:
Group Spin 10000: (2.28, 0.98)
Master Spin 1000: (2.45, 0.98)
Yielding: (2.52, 1.01)
Dispatch: (2.19, 1.02)
These are all JVM concurrency primitives, which are different ways to handle thread contention. All four cluster in a tight band: perf ~2.2–2.5, medium ~0.98–1.02. Essentially the same performance envelope, four different syntactic paths to it.
What the cluster tells the agent: the concurrency-primitive axis is exhausted. No matter which variant you try, you end up in the same neighborhood. A gradient-descent agent would have kept trying more spin variants. K2.6 stopped and switched axes, and the eventual winner, V2, is “Empty-Set Short-Circuit,” which is a logic optimization, not a concurrency optimization. It changes what work gets done, not how it gets scheduled.
This is the same regime-change pattern we saw in the Zig run, i.e, recognize regime exhaustion to pivot to an orthogonal axis. It requires memory of what has been tried and categorization of those attempts into regimes, so you can reason about which regime you’re currently exhausting.
Two different tasks, 13 hours apart, same behavioral signature. That’s a pattern.
Observation 10: The thread topology change
Moonshot’s launch text explicitly calls out that the agent reconfigured “the core thread topology from 4ME+2RE to 2ME+1RE.” This is a meaningful architectural change: reducing matching-engine and risk-engine thread counts to optimize for the contention patterns the agent had identified via flame graph analysis.
But this change is not labeled on the chart as its own version. It must be embedded inside V1 or V2. Most likely V1, since “CPU-aware Tuning” is exactly the category a thread-topology change would fall under.
The fact that a whole structural refactor is contained inside a single labeled version, rather than being its own point, tells us the agent’s ledger has a hierarchical structure: versions are not “one change per version,” but they’re bundled sets of coherent changes that move together on the Pareto plot. The agent isn’t just tracking what changed. It’s grouping changes into conceptual commits.
I found the same pattern across two very different tasks:
One was a ground-up kernel implementation in a niche language on a fresh codebase.
The other was a surgical refactor of an 8-year-old production Java engine. Different tools, different languages, different failure modes but same memory behaviors.
None of these are model-scale properties. All of them are memory-system properties.
The chart is not a story about a 1T-parameter MoE being smart. It is a story about an agent loop with a working memory, a scratchpad, a skills ledger, and the discipline to use all three. The model is a component in that system, not the whole system.
Moonshot didn’t build a smarter model. They built a memory system around a familiar model and taught the model to cooperate with it. The two charts are the proof.
3 Practical Takeaways
If you’re building on K2.6 or any model trying to do long-horizon work.
Design for the scratchpad, not the window: K2.6's 256K context is a cache, not a working set. Your agent harness should give the model a reliable filesystem it can write progress notes to. If you want to add a managed memory layer rather than building your own scratchpad infrastructure, this is exactly the problem Mem0 is designed to solve by providing persistent, structured memory across sessions that the model can read from and write to without you managing the compressor yourself.
Budget for regression-testing: The orange dots aren’t noise. They’re a feature. An agent that regression-tests its own progress is more reliable over long horizons. If your harness evicts old benchmark results or past attempts from context, the agent loses the ability to ablate, and without ablation, architectural regressions go undetected.
Measuring memory behavior: The next generation of agent benchmarks will evaluate (a) whether the agent writes to external memory, (b) whether it reads back consistently, (c)whether it detects its own regressions, (d) whether it recovers from a rollback. Moonshot’s internal Claw Bench already evaluates “Memory Utilization” as a distinct axis, and I’d bet on that framing generalizing. If you’re building evals, start there, not at “how many tokens fit in the window.”
What This Means for Agents You Are Building Today?
The staircase pattern, the regression-testing clusters, the regime-exhaustion pivots: none of this happens without a memory system that persists state across thousands of tool calls. Kimi K2.6 built this into the model weights. For agents you are building today, you do not have to.
Mem0 gives any agent, regardless of the underlying model, the same persistent memory behavior: branching on prior attempts, regression-testing against known good states, and pivoting when a strategy is exhausted.
Add persistent memory to your agent in 3 lines with Mem0
What Kimi K2.6's traces actually show you
The staircase pattern, the regression-testing clusters, the regime-exhaustion pivots, but none of this happens without a memory system that persists state across thousands of tool calls. Kimi K2.6 built this into the model weights. For agents you're building today, you don't have to.
Mem0 gives any agent, regardless of the underlying model, the same persistent memory behaviour: branching on prior attempts, regression testing against known-good states, and pivoting when a strategy is exhausted. It works with GPT-4o, Claude, Gemini, and local models.
The Bottom Line
I didn’t run a 12-hour test. I didn’t need to. Moonshot ran two of them, published the traces, and the traces tell a more specific story than their own blog post narrates.
K2.6’s long-horizon capability is a memory-system capability, not a model-scale capability. The staircase and regression-testing in the Zig chart, the Pareto trade-offs and regime pivots in the exchange-core chart, every one of these behaviors requires a durable memory of past states that extends beyond the context window. That memory is being actively managed, probably by a combination of the model (internalized summarization) and the Kimi Code harness (scratchpads, skills, truncation policies).
And crucially: we see the same pattern across two unrelated tasks. A kernel implementation in Zig on fresh code and a production Java refactor 8 years old share essentially nothing at the task level, but the agent exhibits the same memory behaviors on both. That’s the signature of an architectural capability, not a demo artifact.
—
💡Build Agents That Remember Like Kimi K2.6
The memory behavior in these traces — persistent state, regression testing, regime-switching — is what separates agents that plateau from agents that compound. Mem0 gives you this infrastructure without building it into the model weights.
Start free on Mem0 · Read the docs · Self-host on GitHub
—
GET TLDR from:

Summarize
Website/Footer

Summarize
Website/Footer

Summarize
Website/Footer

Summarize
Website/Footer