

Quick Takeaways
Our HNSW indexes recorded 0 scans in production while every vector query fell back to an 8-to-14-second sequential scan over a 1,153 GB table.
Those unused indexes were quietly costing us 325 GB of storage with no query benefit. Dropping them made inserts about 99x faster and updates about 36x faster on their own.
The root cause: Postgres's query planner correctly decided that a sequential scan was cheaper than our HNSW index once selective multi-tenant filters entered the query.
We moved vectors to Turbopuffer and kept relational data in Postgres. End-to-end retrieval now averages around 110 to 120 ms and stays consistent as data grows.
If you have under roughly 10 million vectors and simple queries, you probably should not migrate. We did, because we hit the exact scale where pgvector stops being the right tool for the job.
We built HNSW indexes on our vector columns, the exact setup every pgvector tutorial recommends. Months later, the index utilization report showed both of them sitting at zero scans. Every vector search in production was quietly ignoring the indexes we'd built and falling back to an 8-to-14-second sequential scan over a 1.1 TB table under high load.
The instinct is to reach for a better index, a REINDEX, a VACUUM, a planner hint. We tried the obvious fixes. None of them were the problem, and the real answer changed how we think about running vectors in Postgres at all. Here's what we found.
The problem
Mem0 stores memories for AI agents, where every memory is a row holding text, metadata, and an embedding. The whole point is to retrieve the right memories at query time, and vector similarity is one important signal in the retrieval process.
The complication is that we are multi-tenant, so every search filters by organization, project, and an entity identifier such as a user, agent, or session, before it ever reaches to the vector search stage. A single query narrows to one tenant's slice of data, then ranks that slice by vector distance. All of this happens while live traffic keeps the table under constant read and write load.
We were doing all of this in one Postgres table, with the relational columns and the high-dimensional vectors living side by side and pgvector handling the similarity search.
The catch is that vectors and rows have opposite access patterns. Relational queries filter on a column and return a few rows, while vector queries compare one input against millions of high-dimensional points. Forcing both through one table and one query planner works fine, until it very suddenly does not.
Original set-up
Our setup was a fairly standard high-end Postgres deployment:
pgvector version: 0.8.0
Cluster: AWS Aurora PostgreSQL with dedicated readers and writers
Instance size: A large, memory-optimized Aurora instance
Primary table: Main memory table with foreign keys to several related tables
Vector columns: Two embedding columns of different dimensions
The table had grown to a real scale:
Component | Size |
|---|---|
Table data only | 115 GB |
Indexes | 86 GB |
TOAST (external storage) | 952 GB |
Total | 1,153 GB |
TOAST is where Postgres puts values too large to fit in-line in a row, and high-dimensional vectors qualify. Almost a terabyte of our table was the overflow storage holding embeddings. We will come back to what that costs you.
Discovering unused indexes
We created HNSW indexes on both vector columns, the index that every pgvector tutorial recommends for similarity search. Then we checked whether the planner was actually using them:
Both vector indexes came back with zero scans.
Every vector query ran a sequential scan and a sort instead, which is exactly why they took 8 to 14 seconds.
This is not a pgvector bug; it is the Postgres planner doing its job. When a query combines vector similarity with selective filters, the planner has to choose between two paths:
Walk the HNSW index, then filter the results, or
Scan the rows that match the filter, then rank them directly.
It makes that choice on a cost estimate, and past a certain selectivity threshold, the cost model decides the sequential scan is cheaper and stops using your index.
This is a well-documented failure mode, with a long trail of pgvector GitHub issues describing the exact symptom:
The planner falls back to a parallel sequential scan even on queries with a small
LIMIT, even afterREINDEXandVACUUM ANALYZE, and even when you try to force its hand with planner hints.One report on pgvector 0.8.0 with about a million rows saw KNN queries land at 30 to 70 seconds for this reason.
A separate DBA writeup from early 2026 traced the mechanism cleanly: at a high enough
ef_search, Postgres estimated the index scan would cost more than reading every row, and the same query jumped from roughly 2.5 ms to 365 ms.
For us, the trigger was the multi-tenant filters. Combining organization, project, and entity identifiers ahead of a <=> distance calculation produced exactly the query shape the planner handles worst. The cosine distance operator has its own history of skipping the index where the Euclidean operator would use it, which compounded the problem even more.
325 GB wasted on unused indexes
We ran an experiment, since if the planner was never using the vector indexes anyway, it was worth seeing what we actually lost by dropping them, and the storage answer was immediate.
Here is the table before and after we deleted the vector indexes:
Metric | Before drop | After drop |
|---|---|---|
Total size | 1,023 GB | 683 GB |
Table data | 79 GB | 78 GB |
Total index size | 359 GB | 34 GB |
TOAST | 944 GB | 605 GB |
The vector indexes alone were consuming about 325 GB, which is storage we were paying to hold, back up, and vacuum while the planner read from it zero times. HNSW indexes can run 3 to 4 times the size of the vector data itself, so this was a large cost hidden inside our storage footprint. The indexes worked exactly what they were built to do, but we had just built them for a query the planner had already decided to skip.
Note: 325 GB is the index portion i.e, the difference between the 359 GB and 34 GB total index sizes above. The before-drop total here reads lower than the earlier snapshot because the two measurements were taken at different times as the table kept growing, so treat them as separate point-in-time readings rather than a single continuous ledger.
The fix
We approached the performance problem in two steps
First, we removed the unused vector indexes from the memory table. They were created to support pgvector similarity search, but with the planner ignoring them, they only added overhead to every write.
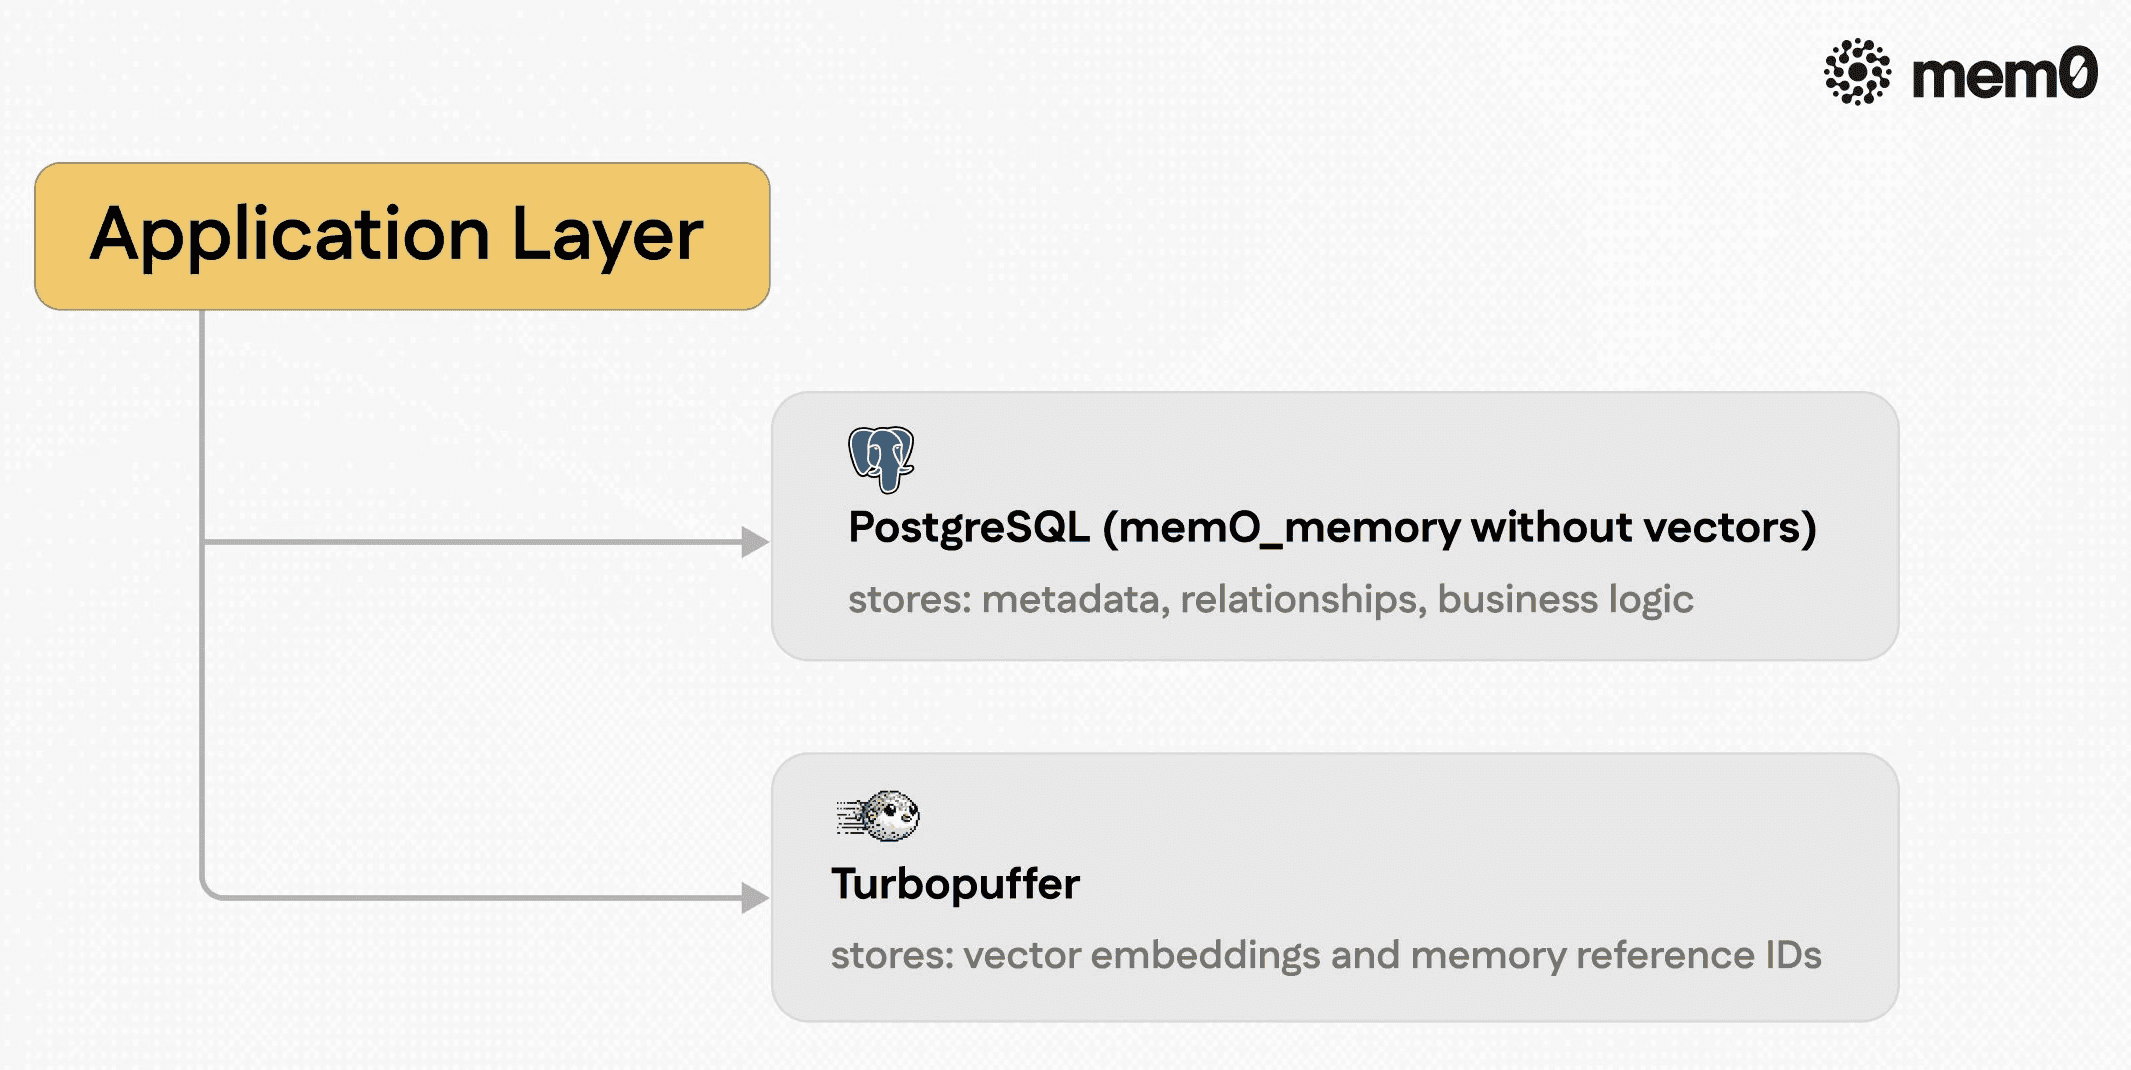
Then, we moved the vectors and the vector search workload to Turbopuffer, which is built specifically for similarity search with storage backed by object storage rather than packed into TOAST tables.
Postgres kept what it does well, i.e, relational data, transactions, and consistency, and Turbopuffer took over the vector similarity component of retrieval.
The new data flow splits cleanly:
We rebuilt retrieval as a two-phase lookup:
Phase 1: Run the vector similarity search in Turbopuffer, which returns the matching memory IDs.
Phase 2: Fetch the full records from Postgres using those IDs.
A caching layer sits in front of frequent queries, and the migration itself ran in four steps. We modified the schema to remove the vector columns from the memory table while keeping every relational column and foreign key, then added Turbopuffer reference IDs. We exported the existing vectors with their memory IDs and bulk-loaded them into Turbopuffer with metadata, validating retrieval accuracy as we went.
Results
We improved our memory operations in the same two steps, and each one moved a different set of numbers.
Step 1: Dropping the unused indexes
After removing the vector indexes from the memory table, we saw significant improvements across SELECT, INSERT, and UPDATE. The write paths gained the most, since every INSERT and UPDATE no longer had to maintain index structures that no query was reading.
Operation | Before | After the indexes dropped | Improvement |
|---|---|---|---|
Insert | 800 ms avg | 8.12 ms avg | ~99x |
Update | 500 ms avg | 13.7 ms avg | ~36x |
Select | 50 ms avg | 13.4 ms avg | ~3.7x |
The APM query-time panels below show each operation on the memory table after the index drop, with the tooltip on each reading the new average.
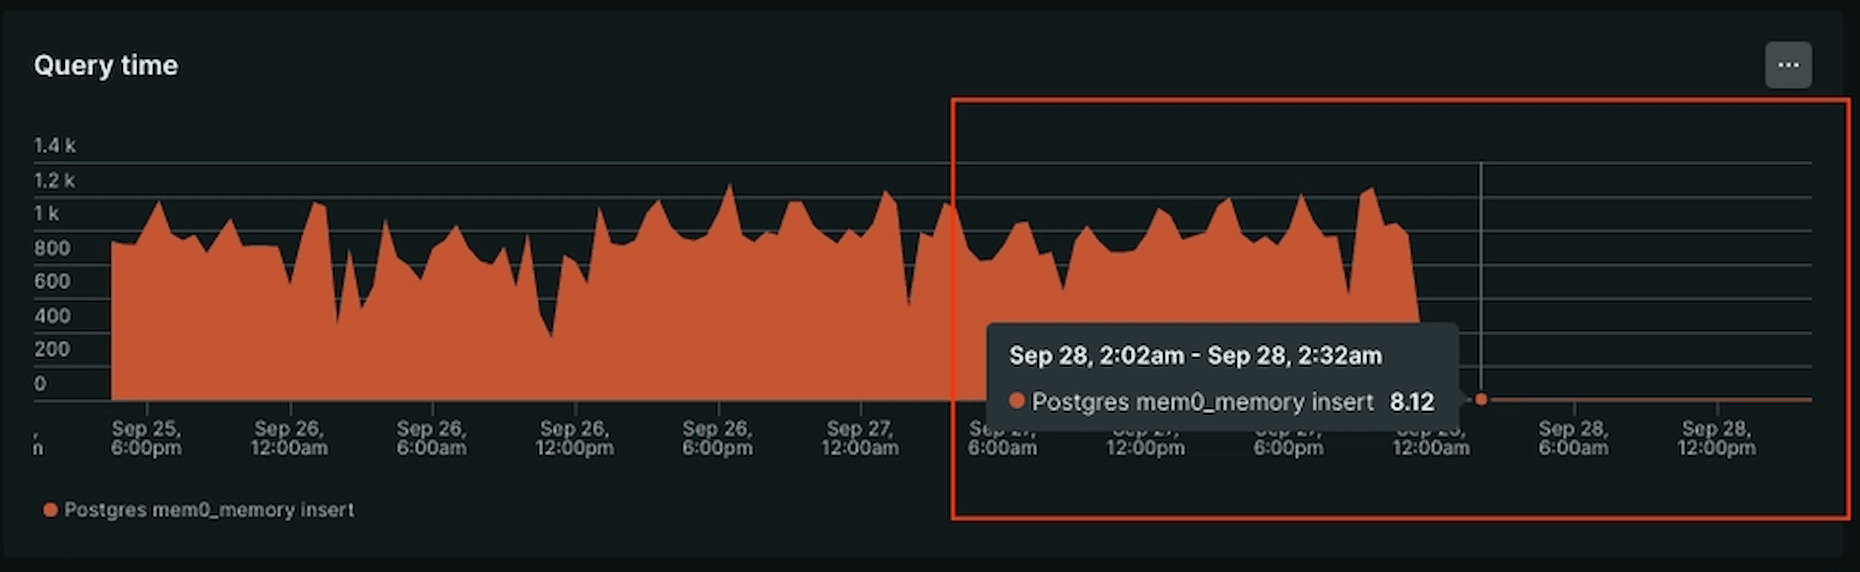
Fig: Insert query time on the memory table settling at 8.12 ms after the index drop, down from a baseline near 800 ms.
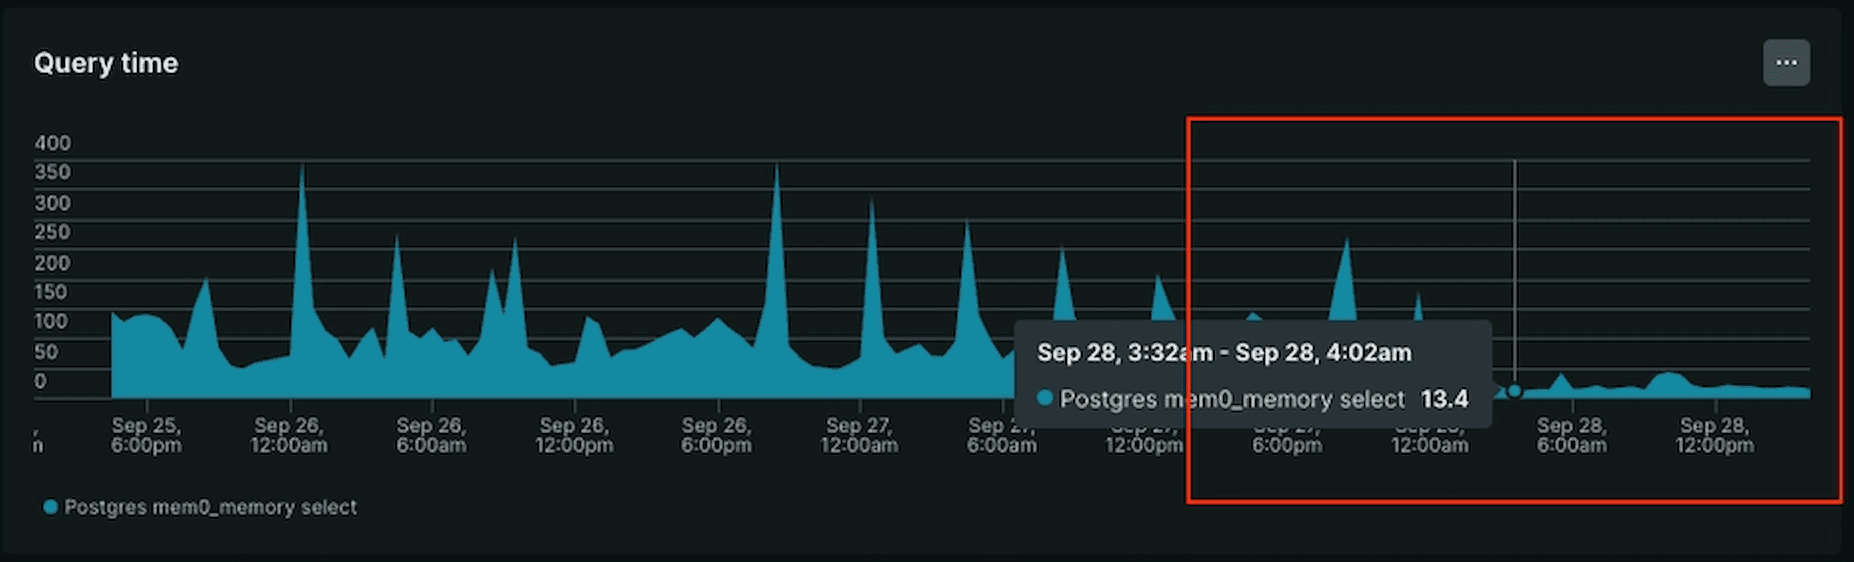
Fig: Select query time improving to an average of 13.4 ms, down from roughly 50 ms.
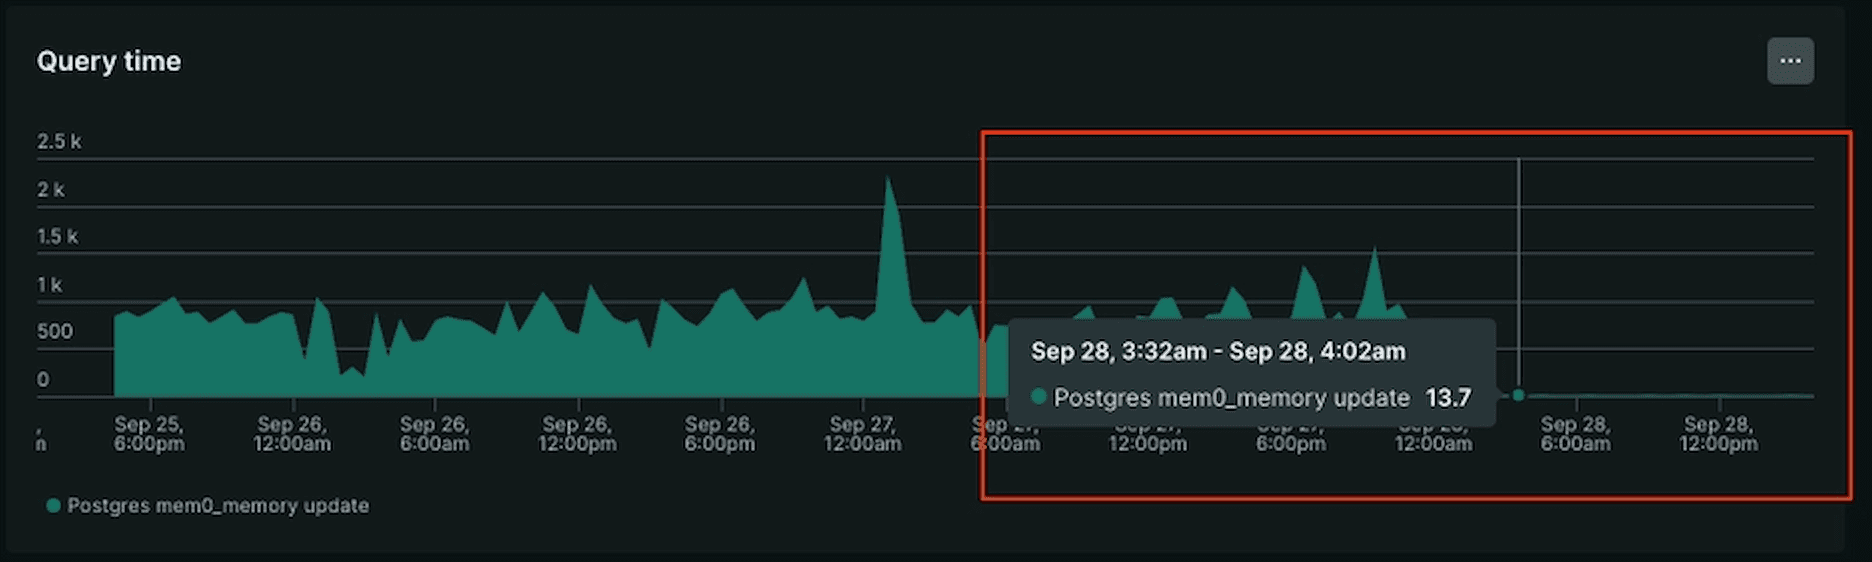
Fig: Update query time landing at 13.7 ms after the index drop, from a 500 ms baseline.
This first step alone fixed our write performance and our storage bloat. But it left the original problem unsolved: we still needed fast vector search, and now we had no vector index at all. SELECT improved to 13.4 ms for simple reads, but similarity search over the full table was still the workload that had pushed us to 8 to 14-second queries in the first place.
Step 2: Moving vector search to Turbopuffer
With vectors and search moved to Turbopuffer, end-to-end retrieval time, measured across all operations in the path, now averages around 110-120 ms and remains consistent as data grows.

Fig: Turbopuffer end-to-end response time holding in the 110 to 120 ms band across the week, with an individual traced call to the Turbopuffer endpoint at 142 ms.
Here is the comparison, with the scope of each number called out so you can judge it fairly:
Before (pgvector): vector similarity search alone took 8 to 14 seconds under high load, because it ran as a sequential scan.
After (Turbopuffer): end-to-end retrieval, including the Turbopuffer search and the Postgres record fetch, averages around 110 to 120 ms.
Comparing the 8-to-14-second pgvector search against the roughly 110 ms Turbopuffer end-to-end path puts the improvement in the range of about 70x.
The Tradeoffs
Splitting the workload isn't free, and it's worth being clear about what we took on. We now run two systems where we ran one, which means more to monitor, more to reason about during an incident, and a new failure mode: a write has to land in both Postgres and Turbopuffer, so the two can drift apart. We treat Postgres as the source of truth: we write the record and its vector in the same request path, and if the vector upsert fails we reconcile Turbopuffer asynchronously. Relational data stays authoritative even when the vector store lags. The two-phase read adds a second network hop: Turbopuffer returns IDs, then Postgres returns the records. The caching layer in front of frequent queries exists partly to absorb that. The storage we reclaimed roughly offset the added cost of a dedicated vector store, so this was close to cost-neutral for us. But the operational surface area did go up, and that's the real price of the split.
Conclusion
Most RAG and memory systems index fewer than 5 million documents, and at that scale, pgvector on Postgres is hard to beat for simplicity and cost. If you are early, or under roughly 10 million vectors with simple queries, staying on pgvector is the sensible default.
However, once you are past 10 million vectors with complex multi-tenant queries, the calculus changes. We had kept vectors and relational rows in the same table long after their access patterns diverged, and the cost showed up as 325 GB of unused indexes and 8 to 14-second searches at 1,153 GB. Splitting vectors into Turbopuffer and keeping relational data in Postgres let each system do what it is good at, and our retrieval latency stopped degrading as we grew.
If your vector queries are slowing down despite indexes you trust, check your index utilization before you change anything else. Run the report and look at the scan counts. If you see zero, the fix may not be a better index at all, but moving vectors out of your relational database entirely.
GET TLDR from:

Summarize
Website/Footer

Summarize
Website/Footer

Summarize
Website/Footer

Summarize
Website/Footer


